
|
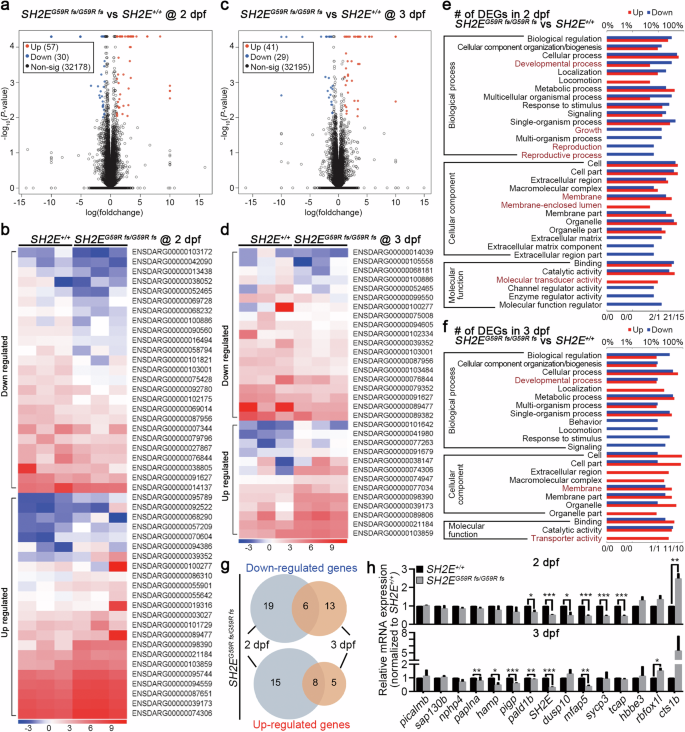
Fig. 6 a Transcriptome sequencing volcano map of the SH2E+/+ siblings (from the same pair of parents as SH2E+/G59R fs) and the SH2EG59R fs/G59R fs mutants at 2 dpf. Fold change > 2 or <0.5, P < 0.05. Down-regulated genes are shown in blue dots, and upregulated genes are shown in red dots. b The DEGs in 2 dpf SH2EG59R fs/G59R fs embryos (15 embryos pooled per sample, n = 3). c Transcriptome sequencing volcano map of the SH2E+/+ siblings and the SH2EG59R fs/G59R fs mutants at 3 dpf. Fold change > 2 or <0.5, P < 0.05. Down-regulated genes are shown in blue dots, and upregulated genes are shown in red dots. d The DEGs in 3 dpf SH2EG59R fs/G59R fs embryos (15 embryos pooled per sample, n = 3). e GO annotation revealed that DEGs in 2 dpf SH2EG59R fs/G59R fs embryos enriched in developmental processes and molecular transmembrane transport processes. f The enrichment of DEGs in 3 dpf SH2EG59R fs/G59R fs embryos was similar to that in 2 dpf embryos. g Eight up-regulated and six down-regulated genes were overlapped between 2 and 3 dpf embryos, respectively. h The results of sequencing were further confirmed by rt-qPCR. Fifteen embryos pooled per sample, n = 3; *P < 0.05, **P < 0.01, and ***P < 0.001 compared with SH2E+/+ from the same SH2E+/G59R fs incross.