
|
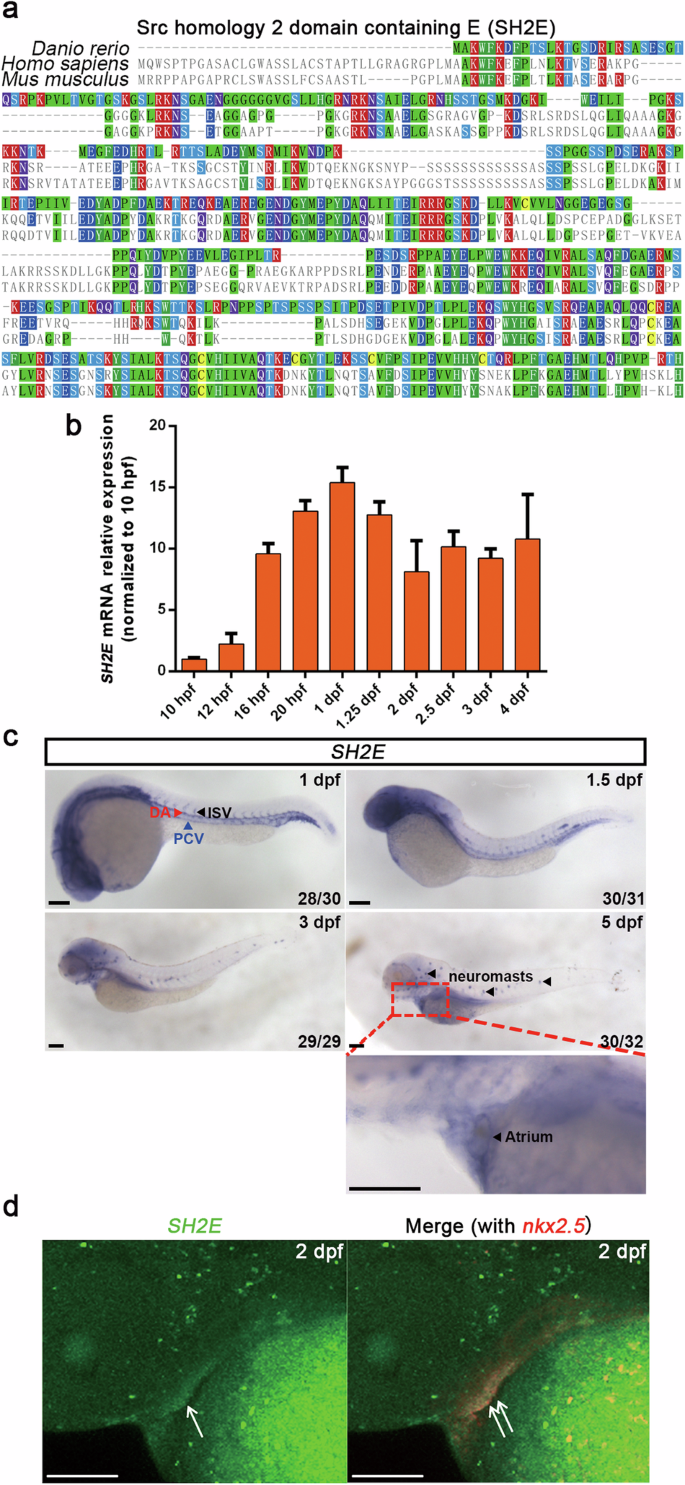
Fig. 1 a Alignment of the zebrafish SH2E protein and its closest human and mouse homologs. b Quantification of SH2E mRNA expression levels at different developmental stages (15 embryos pooled per sample, n = 3). c Expression pattern of SH2E analyzed by WISH during 1 to 5 dpf, and the developmental time points are indicated in the panels. The ISVs are indicated by black arrowhead, and the DA and the PCV are indicated by red arrowhead and blue arrowhead, respectively. Neuromasts are also indicated by black arrowheads, and the region including atrium is magnified below. The number in the bottom right-hand corner indicates the representative embryos/total embryos. d Dc-FISH for SH2E and the myocardium marker nkx2.5 in 2 dpf embryos. For (c, d), scale bars = 100 μm.