IMAGE

Figure 1

ID
ZDB-IMAGE-250329-66
Source
Figures for Cho et al., 2025
Image
Figure Caption

Figure 1

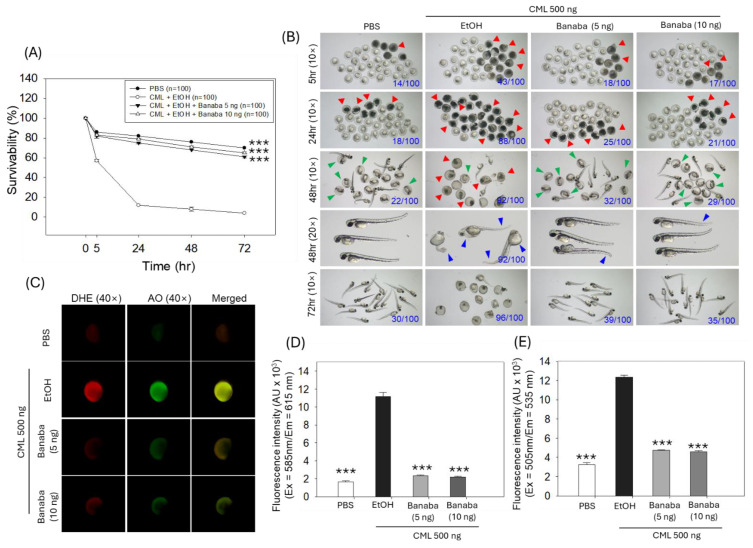
Effect of banaba leaf extract against carboxymethyllysine (CML)-induced toxicity in zebrafish embryos (n = 100). (A) The embryo survivability kinetics at two different concentrations (5 ng or 10 ng banaba/embryo). The symbol *** (p < 0.001) indicates the statistical significance of the difference between groups vs. EtOH+CML-injected group as determined by a two-way ANOVA, followed by Tukey’s post-hoc analysis. (B) Pictorial representation of zebrafish embryos among the different groups 5 h to 72 h post injection. Blue numerical values inside the images represent the number of dead embryos/total embryos (n = 100). The red arrowhead highlights the dead embryos, the green arrowhead represents the unhatched embryos 48 h post injection, and the blue arrowhead underscores the developmental deformities. (C) Dihydroethidium (DHE) and acridine orange (AO) fluorescent imaging of the embryos. (D,E) Quantification of DHE and AO fluorescence intensity using the Image J software. Abbreviations: PBS (phosphate buffered saline), EtOH (ethanol), CML (carboxymethyllysine). The symbol *** signifies the statistical difference at p < 0.001 vs. EtOH+CML-injected group.

Acknowledgments
This image is the copyrighted work of the attributed author or publisher, and ZFIN has permission only to display this image to its users. Additional permissions should be obtained from the applicable author or publisher of the image. Full text @ Pharmaceuticals (Basel)