
Fig. 4
- ID
- ZDB-IMAGE-250327-102
- Publication
- Perone et al., 2025 - Zebrafish Cyp1b1 knockout alters eye and brain metabolomic profiles, affecting ocular and neurobehavioral function
- All Figures
- Figures for Perone et al., 2025
|
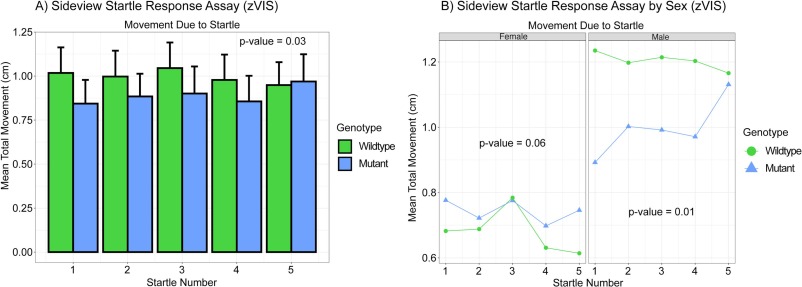
Fig. 4 A) Bar graph of the sideview startle response assay (zVIS). This assay takes place following the sideview predator assay. A single fish’s movement in tracked during 10 consecutive mechanical vibrations every 20 s. Mean total movement during each of the taps is calculated and measured in cm. The first five taps are displayed. There was a significant difference between the genotypes when measuring mean total movement due to the startle (vibration). P-value = 0.03, n = 61 WT and 57 mutant, two-way ANOVA. B) Line graph of sideview startle response assay by sex (zVIS). There was a significant difference between the sexes when measuring mean total movement due to the startle (vibration). P-value = 1.82x10⁻⁵, n = 61 WT and 57 mutant, three-way ANOVA. When analyzed alone females did not exhibit statistically significant changes in behavior while males did. P-value = 0.06 and 0.01, two-way ANOVA.