
Image
|
Figure Caption
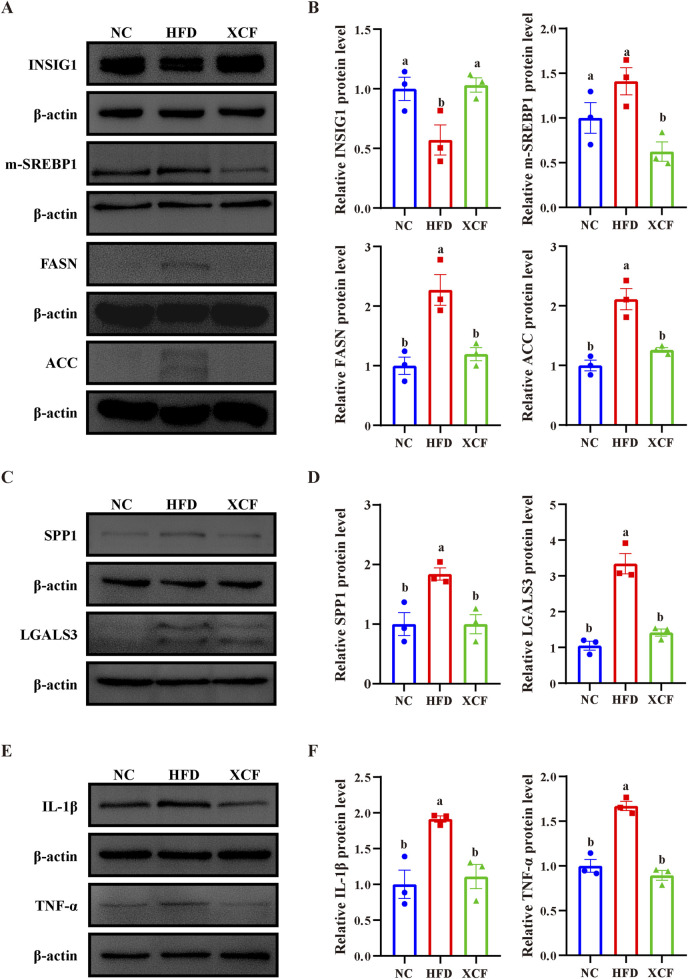
FIGURE 6
Effects of XCF on lipid synthesis metabolism, fibrosis, and inflammation-related gene expression in the livers of HFD-fed mice.
Acknowledgments
This image is the copyrighted work of the attributed author or publisher, and
ZFIN has permission only to display this image to its users.
Additional permissions should be obtained from the applicable author or publisher of the image.
Full text @ Front Pharmacol