IMAGE

FIGURE 2

ID
ZDB-IMAGE-250325-15
Source
Figures for Liang et al., 2025
Image
Figure Caption

FIGURE 2

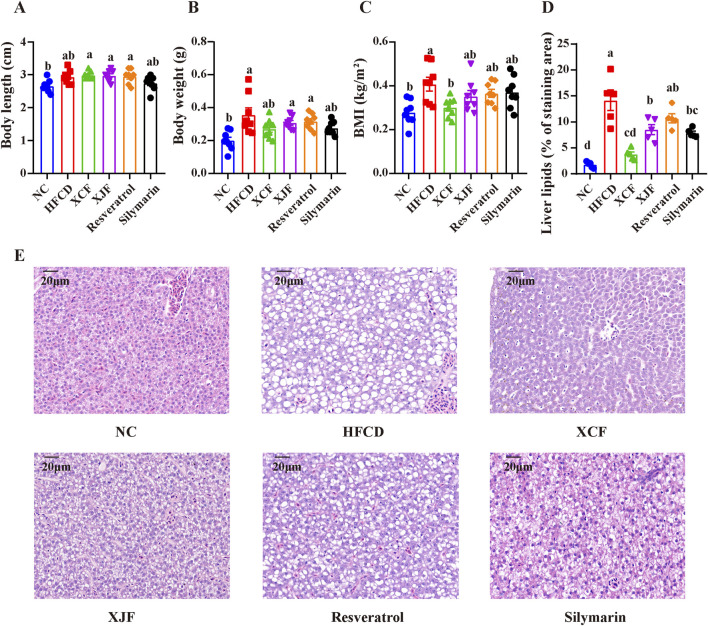
Effects of different herbal formulas on BMI and morphological changes in the liver cells of zebrafish with MAFLD. (A) Body length (n = 8); (B) Body weight (n = 8); (C) BMI (n = 8); (D) Liver lipids (% of staining area) (n = 5); (E) Micrographs of H&E-stained livers (bar = 20 μm). The data are presented as the means ± SEMs. Data with different letters are significantly different (P < 0.05). NC: normal control group; HFCD: high-fat and high-cholesterol diet group; XCF: xiaoji-chenpi formula extract treatment group; XJF: xiaoji-jujv formula extract treatment group; Resveratrol: resveratrol treatment group; Silymarin: silymarin treatment group.

Acknowledgments
This image is the copyrighted work of the attributed author or publisher, and ZFIN has permission only to display this image to its users. Additional permissions should be obtained from the applicable author or publisher of the image. Full text @ Front Pharmacol