
Image
|
Figure Caption
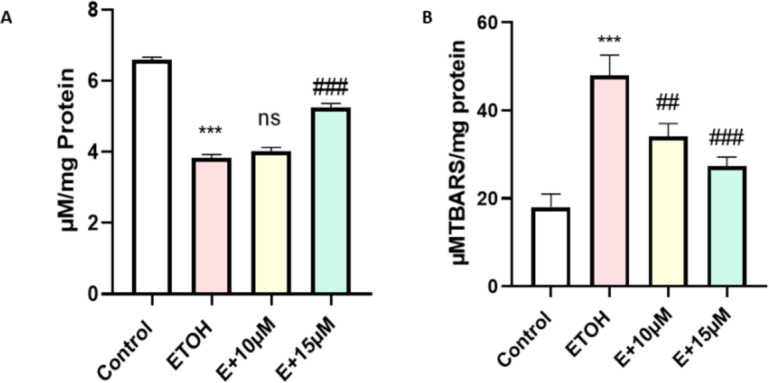
Fig. 5
Effect of ETOH and in combination with benzydamine on cellular oxidative stress markers. (A) GSH (B) LPO. Data represented as mean ± SD of replicate samples. ***
Acknowledgments
This image is the copyrighted work of the attributed author or publisher, and
ZFIN has permission only to display this image to its users.
Additional permissions should be obtained from the applicable author or publisher of the image.
Full text @ Sci. Rep.