
Image
|
Figure Caption
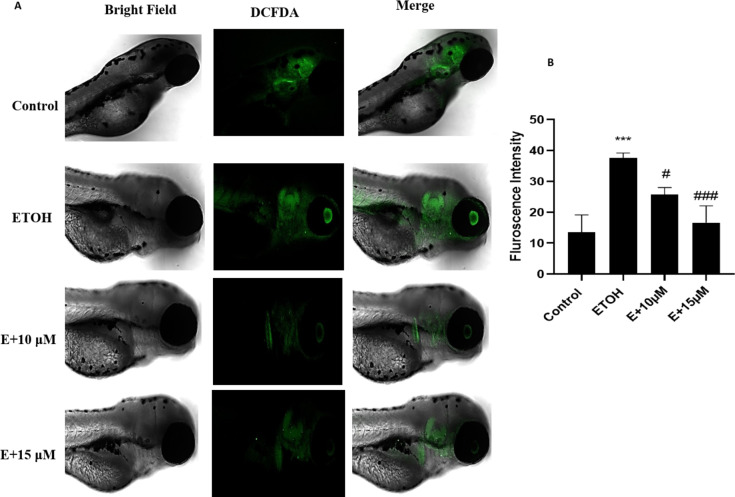
Fig. 4
Reactive Oxygen Species (ROS) generation after exposure to 1% ETOH and in combination with benzydamine. (A) ROS generation (B) Fluorescence Intensity measured using image J. Data represented as mean ± SD of replicate samples. ***
Acknowledgments
This image is the copyrighted work of the attributed author or publisher, and
ZFIN has permission only to display this image to its users.
Additional permissions should be obtained from the applicable author or publisher of the image.
Full text @ Sci. Rep.