
Image
|
Figure Caption
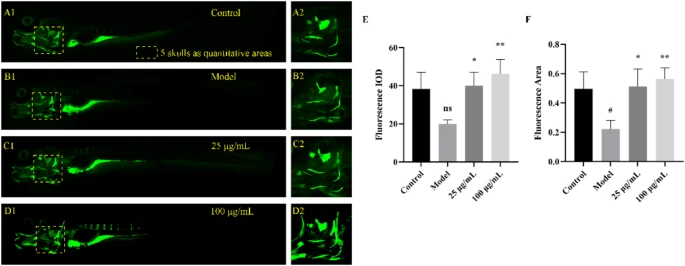
Fig. 2 (A1–D1) Fluorescence images depicting the entire zebrafish skeleton at 4× magnification. (A2–D2) Fluorescence intensity images of zebrafish skulls at 20× magnification. (E) Quantification of the relative fluorescence intensity of zebrafish skulls. (F) Quantification of the fluorescence area of zebrafish skulls. Data are presented as mean ± SD. #P < 0.05 versus the control group. *P < 0.05 and **P < 0.01 versus the model group.
Acknowledgments
This image is the copyrighted work of the attributed author or publisher, and
ZFIN has permission only to display this image to its users.
Additional permissions should be obtained from the applicable author or publisher of the image.
Full text @ Sci. Rep.