
|
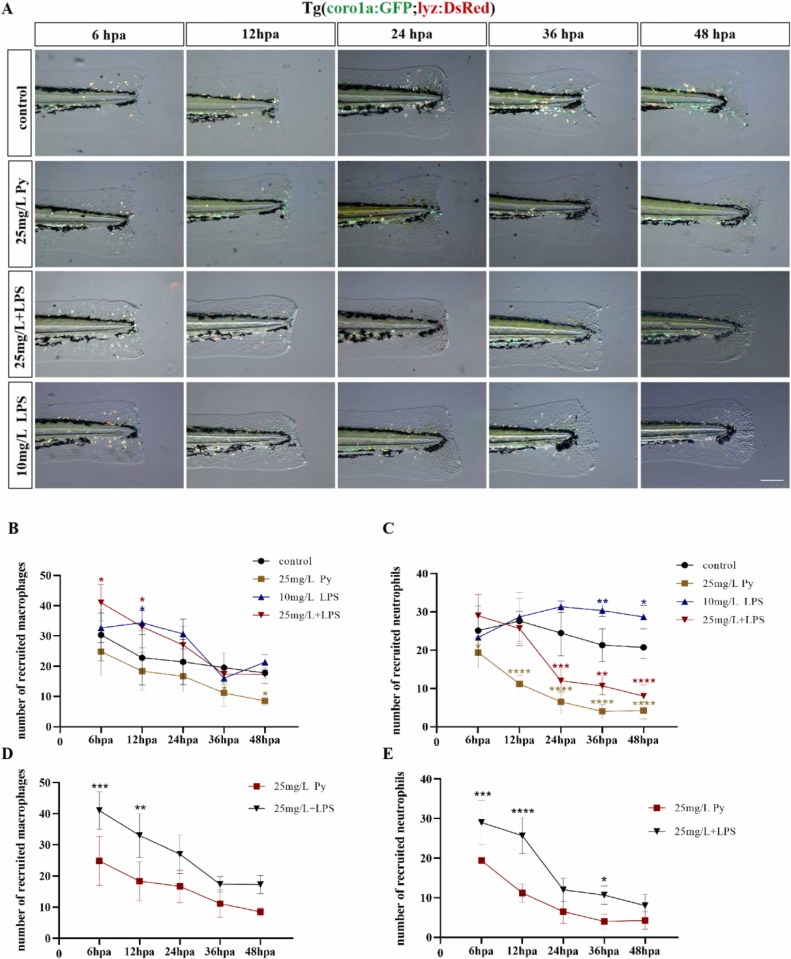
Fig. 4 Neutrophil and macrophage changes at the caudal fin of zebrafish larvae induced by pyrazosulfuron-ethyl and LPS rescue experiment (A). Changes in neutrophils and macrophages in the caudal fin of zebrafish larvae at different time points (6, 12, 24, 36, 48 hpa) in different treatment groups (25 mg/L PY, 10 mg/L LPS, 25 mg/L PY + 10 mg/L LPS). Tg (coro1a: GFP) transgenic line labels neutrophil and macrophage, and Tg (lyz: DsRed) transgenic line labels neutrophil. Green fluorescent dots are macrophages and overlapping yellow fluorescent dots are neutrophils. (B). The number of neutrophils in different treatment groups at different time points. All treatment groups were compared with the control group. (C) The number of macrophages in different treatment groups at different time points. All treatment groups were compared with the control group. (D) LPS induced neutrophil compares with PY group. (E) LPS induced macrophage compares with PY group. (Data represent mean ± S.D. ns>0.05, * p < 0.05, ** p < 0.01, *** p < 0.001, **** p < 0.0001. ns is not labelled in the graph. Scale bar: 100 μm.).