
|
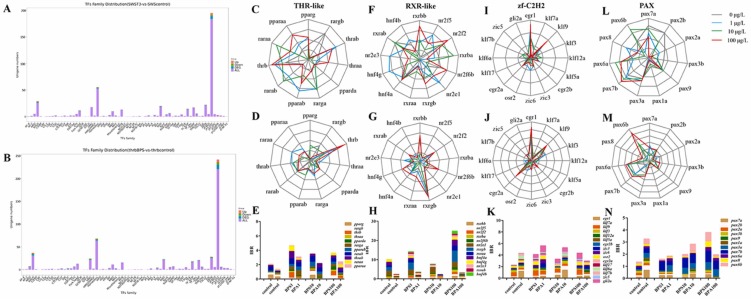
Fig. 5 The analysis of transcription factors (TFs) in larval eyes respond to BPA or BPS. (A and B) Numbers of DEGs in each transcription factor family detected in larval eyes under BPA (A) or BPS (B) stress vs. control. Note: Fold change cutoff ≥ 1.5 and FDR < 0.05 were used to identify DEGs here. (C-L) Star plots for biomarkers response in THR-like, RXR-like, zf-C2H2 and PAX family under BPA exposure stress (1, 10 and 100 μg/L), respectively. (D-M) Star plots for biomarkers response in THR-like, RXR-like, zf-C2H2 and PAX families under BPS exposure stress (1, 10 and 100 μg/L), respectively. (E-N) The variation of total IBR values in THR-like, RXR-like, zf-C2H2 and PAX family under the stress of BPA or BPS, respectively.