
|
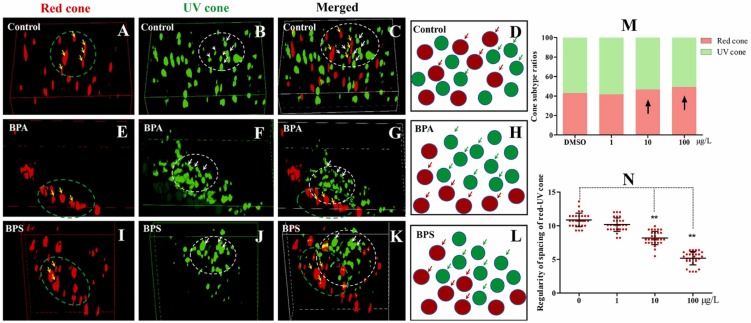
Fig. 3 Effects of BPA exposure on the mosaic arrays of red cone and UV cone cells in zebrafish larvae (n = 30). (A, B and C) Cone photoreceptor subtype positions in the control retina from the 5dpf Tg zebrafish larvae determined by mCherry+ (red) and GFP+ (green) protein for opsin expression. Note: The red cone cells are labled by Red fluorescent protein (mCherry+), and UV cone cells are labled by green fluorescence protein (GFP). The yellow arrow points to the red cone, and the white arrow points to the UV cone. (E, F and G) Cone subtype positions in the BPA- exposed retina. (I, J and K) Cone subtype positions in the BPS- exposed retina. (D, H and L) Schematic of the planar mosaic arrangement of red and UV cone cells in larval fish in control, BPA and BPS group, respectively. Note: The green arrows points to the UV cones, and the yellow arrows toward the red cones,. (M) Ratios of red and UV cone photoreceptor subtypes in zebrafish retina in 1, 10 and 100 μg/L BPA exposure. The ratio is calculated with the number cones from regions examined in retina. (N) Regularity of spacing of cone subtypes in 1, 10 and 100 μg/L BPA exposure in zebrafish retina. Note: Conformity ratio (nearest-neighbor distance/standard deviation) is used to evaluate the regularity of red cone and UV cone spacing within cone subtypes. The larger the ratio, the better the regularity. Asterisk represents significant difference (**p < 0.01 and *p < 0.05) compared with the control.