
|
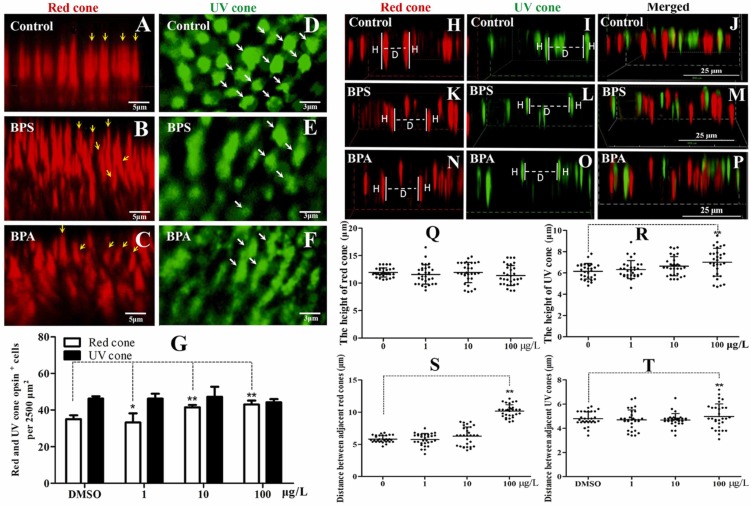
Fig. 2 Effects of BPA exposure on the number and morphology of cone photoreceptors in larvae of 5dpf Tg zebrafish (n = 30). (A, B and C) Stereoscopic scanning image of red cone photoreceptors in DMSO, BPS and BPA groups, respectively. Note: The yellow arrows toward the mosaic arrays of red cones. (D, E and F) Stereoscopic scanning image of UV cone exposed to DMSO, BPS and BPA, respectively. Note: The yellow arrow points to mosaic arrays of the UV cells. (G) Quantification of the number of red and UV cone cells in 5dpf larvae reveals that the total number of red cone is increased by 10 and 100 μg/L BPA exposure. (H, I and J) The morphology of both red and UV cone in control DMSO group. Note: H means the height of cone cell. D means the distance between adjacent red or UV cones. (K, L and M) The changes of morphology of the red and UV cones in BPS exposure group. (N, O and P) The changes of morphology of the red and UV cones in BPA exposure group. (Q) The height of the red cone was not influenced in 1, 10 and 100 μg/L BPA groups (5 dpf). (R) The height of UV cone increased in 100 μg/L BPA group. (S) and (T) The distance between adjacent red or UV cones increased in 100 μg/L BPA group. Note: Asterisk indicates significant difference compared with the DMSO control, *p < 0.05 and * *p < 0.01.