IMAGE

Fig. 8

ID
ZDB-IMAGE-250318-5
Source
Figures for Vaz-Rodrigues et al., 2025
Image
Figure Caption

Fig. 8

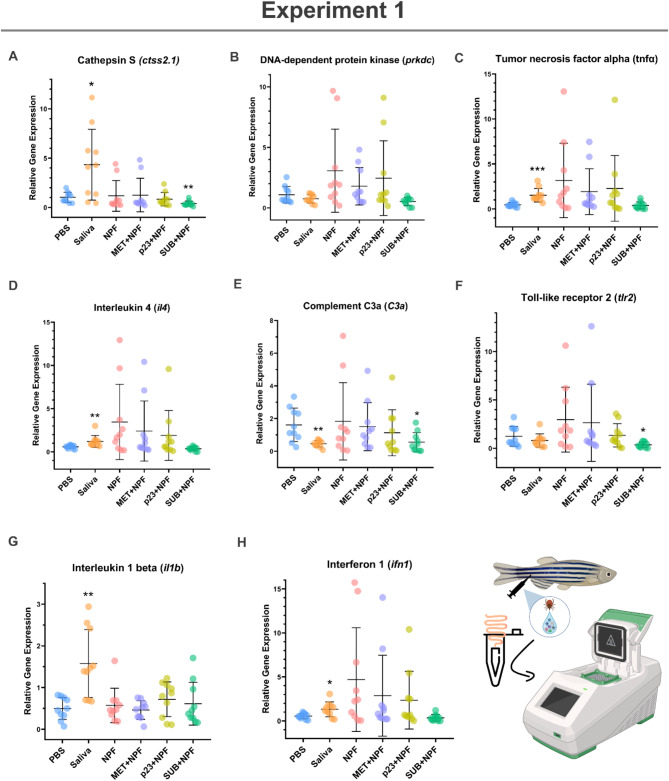
Experiment 2: Expression levels of different zebrafish gut immunity and allergy biomarkers. The mRNA levels were analyzed by quantitative reverse transcription polymerase chain reaction (RT-qPCR). Expression levels were characterized in zebrafish samples collected from Experiment 2 (Fig. 3, Experimental design to evaluate the role of combined treatment with tick salivary proteins and fish tuberculosis). The mRNA levels for (A) Cathepsin S, (B) DNA-dependent protein kinase, (C) Tumor necrosis factor alpha, (D) Interleukin 4, (E) Complement C3a, (F) Toll-like receptor 2, (G) Interleukin 1 beta and (H) Interferon 1 were analyzed by quantitative reverse transcription polymerase chain reaction (RT-qPCR). Significant differences between groups were analyzed using the Real Statistics extension for Microsoft Excel (v2310) and data was depicted with GraphPad Prism (version 8.0.1) ((* p < 0.05, ** p < 0.01, *** p < 0.001).

Acknowledgments
This image is the copyrighted work of the attributed author or publisher, and ZFIN has permission only to display this image to its users. Additional permissions should be obtained from the applicable author or publisher of the image. Full text @ Sci. Rep.