
|
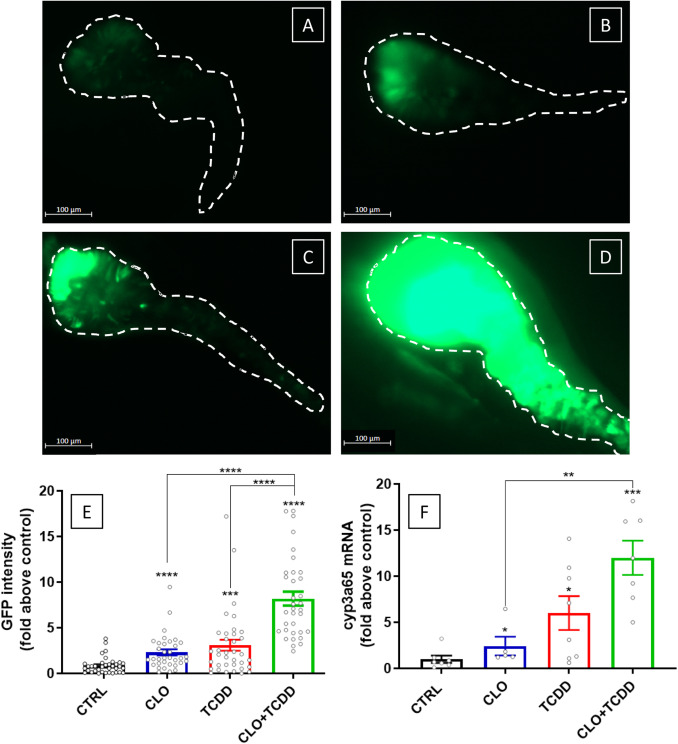
Fig. 1 GFP fluorescence and cyp3a65 mRNA are induced in presence of CLO or TCDD and over-induced when embryos are coexposed to CLO+TCDD. In vivo imaging of tg(cyp3a65:GFP) embryos at 120 hpf. The dashed lines delineate the intestine. Expression in control (CTRL) DMSO 0.02% (A) and exposed embryos to CLO 1.5 µM (B); TCDD 0.05 nM (C) and CLO 1.5 µM + TCDD 0.05 nM (D). (E) corresponds to GFP intensity in individuals (n = 21 embryos minimum per condition) after exposure to CLO 1.5 µM (in blue); TCDD 0.05 nM (in red) and CLO 1.5 µM + TCDD 0.05 nM (in green), control condition (CTRL) is DMSO 0.02% (in black). (F) cyp3a65 mRNA expression in pooled zebrafish embryos (n = 5 embryos/pool) in same condition.