
|
Figure 2.
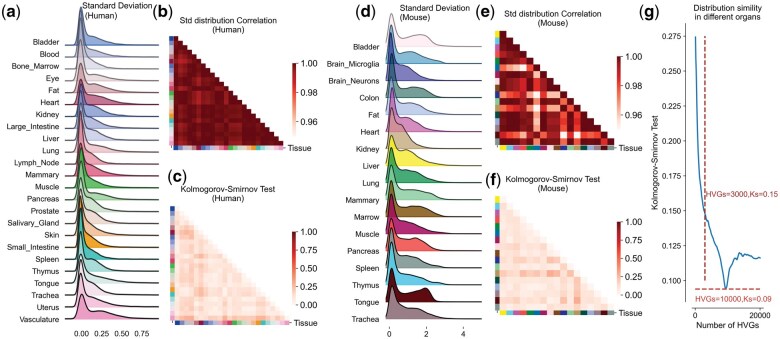
Distribution regularity of HVG expression across multiple tissues and organs in human and mouse. (a) The standard deviation (Std) of the expression of the top 10 000 HVGs across 24 human tissues and organs. (b) The distribution correlation of Std values in cells of 24 human tissues and organs. (c) The Kolmogorov-Smirnov Test values in cells of 24 human tissues and organs. (d) The standard deviation (Std) of the expression of the top 10 000 HVGs across 17 mouse tissues and organs. (e) The distribution correlation of Std values in cells of 17 mouse tissues and organs. (f) The Kolmogorov-Smirnov Test values in cells of 17 human tissues and organs. (g) The distribution of Std simility in different number of HVGs. Std, standard deviation.