
Image
|
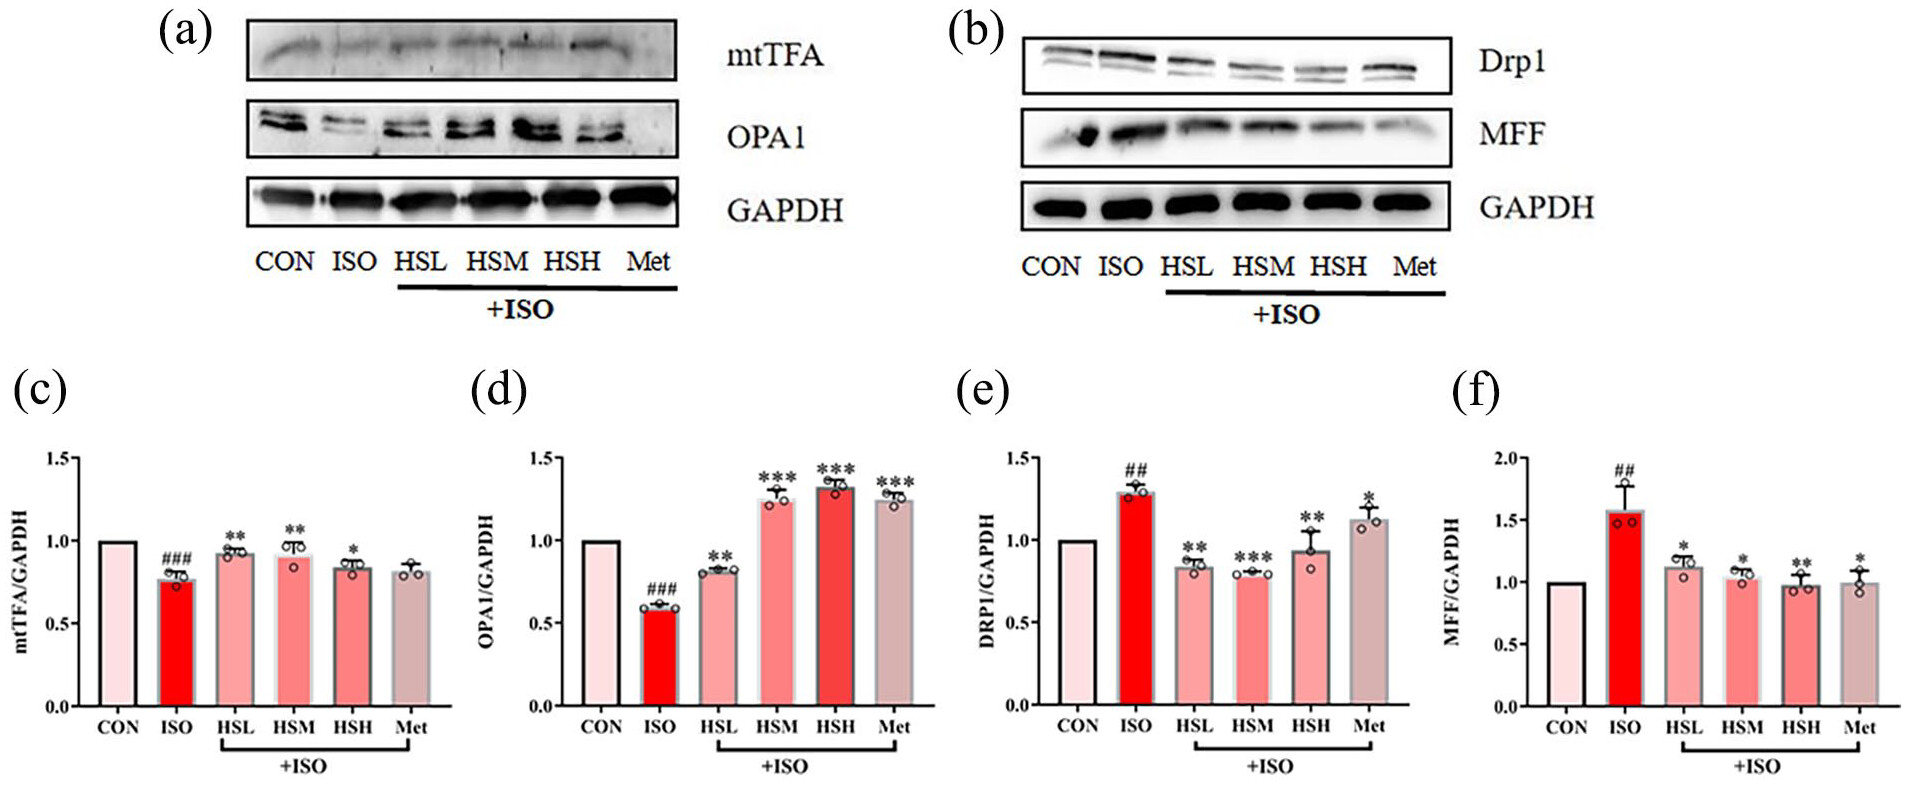
Figure Caption
Fig. 4 Western-blot expression of mtTFA (a, c), OPA1 (a, d), Drp1 (b, e), and MFF (b, f) was appraised in HL-1 cells treated by indicated concentration of baicalein or met within/without ISO. Results were presented as mean ±SD (n ≥ 3). ##p < 0.01, ###p < 0.001, versus CON, *p < 0.05, **p < 0.01, ***p < 0.001 versus ISO.
Acknowledgments
This image is the copyrighted work of the attributed author or publisher, and
ZFIN has permission only to display this image to its users.
Additional permissions should be obtained from the applicable author or publisher of the image.
Full text @ Int J Immunopathol Pharmacol