IMAGE

Fig. 1

ID
ZDB-IMAGE-250307-51
Source
Figures for Hu et al., 2025
Image
Figure Caption

Fig. 1

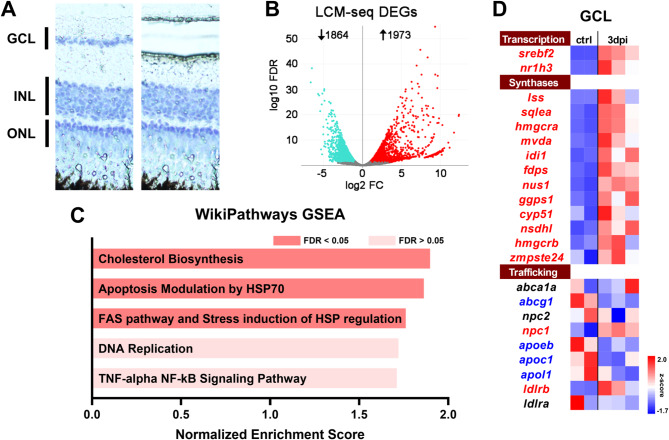
LCM-seq analysis of 3 dpi retinal ganglion cell layer (GCL) identifies upregulation of the cholesterol synthesis pathway. (A) Representative image from pre- and post-GCL LCM retina section. (B) Volcano plot (|FoldChange| > 1, FDR < 0.05) of differentially expressed gene from 3 dpi (n = 3) vs. uninjured GCL (n = 2). (C) GSEA of DEGs genes based on zebrafish WikiPathways. (D) Heatmap of cholesterol-related transcriptional regulators, cholesterol synthases, and cholesterol trafficking genes of 3 dpi vs. uninjured from GCL. Gene names in red or blue indicates p < 0.05 by DEseq2 in 3 dpi group versus control where red represents upregulated genes and blue represents downregulated genes

Acknowledgments
This image is the copyrighted work of the attributed author or publisher, and ZFIN has permission only to display this image to its users. Additional permissions should be obtained from the applicable author or publisher of the image. Full text @ Mol. Neurodegener.