
|
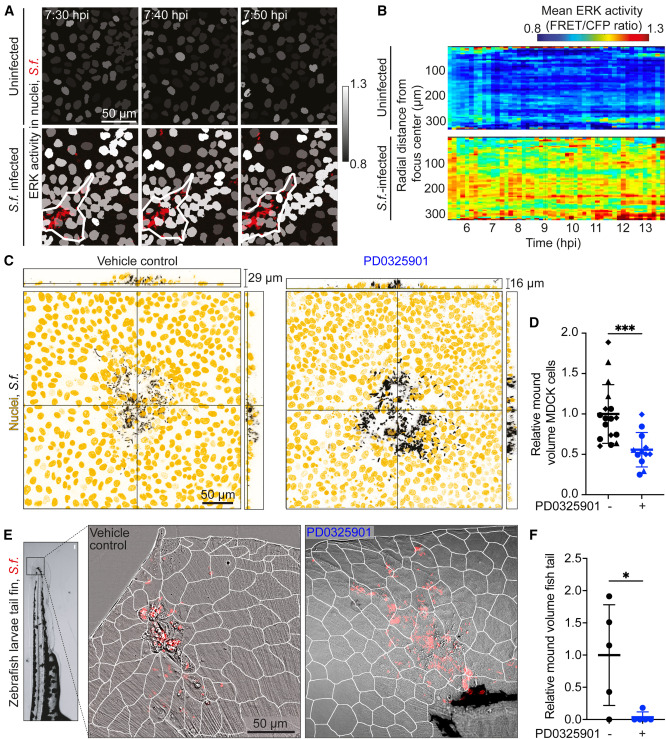
Fig. 7 ERK waves also drive collective extrusion of S.f.-infected cells in vitro and in vivo (A) Representative snapshots of ERK activity in the nuclei of uninfected (top) and S.f.-infected MDCK cells (bottom) overlayed with S.f. fluorescence (red). Columns: three consecutive time points (hpi). (B) Kymograph of mean radial ERK activity (y axis) versus time (hpi, x axis) for uninfected (top) or S.f.-infected MDCK cells (bottom) (see Figure S4F). (C) Orthogonal views of S.f.-infected MDCK cells 16 hpi treated with vehicle control (left) or 50 μM PD0325901 (right) at 4 hpi. Host nuclei: yellow; S.f.: black. (D) Relative mound volume of S.f.-infected MDCK cells treated with vehicle control or 50 μM PD0325901. Normalization to mean of control cells. Mean ± SD, WRST: ∗∗∗p < 0.001. (E) Representative overlay of phase-contrast images with S.f. fluorescence (red) of zebrafish larvae fin tails treated with vehicle control or 41 μM PD0325901. White lines: cell contours. Image on left shows the location of the area imaged in zebrafish larvae. (F) Relative mound volume of S.f.-infected extruded epithelial cells from the skin of zebrafish larvae fin tails. Samples inspected at 6 hpi. Normalization with respect to mean of control zebrafish fin tails. Mean ± SD, WRST: ∗p < 0.05. See also Figure S7.