
|
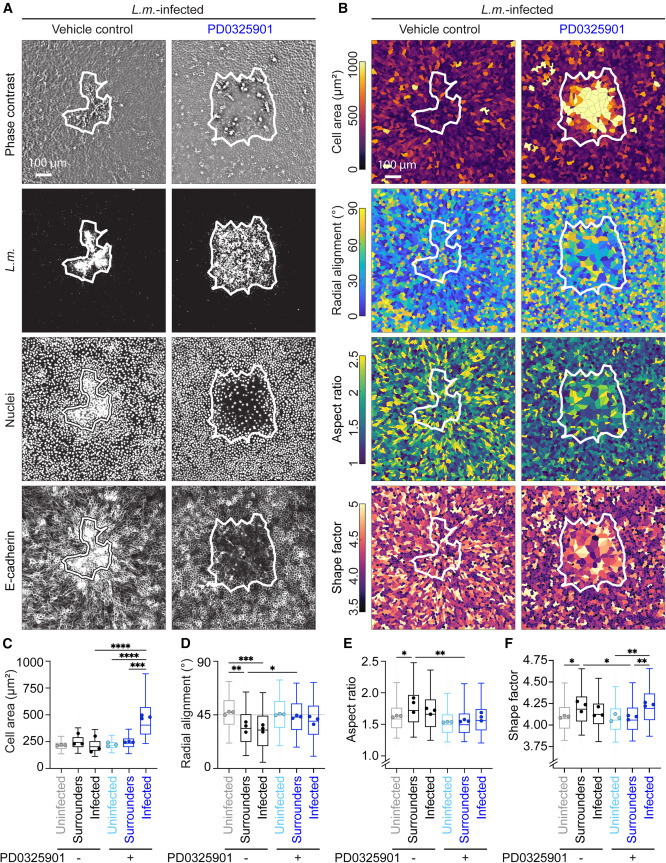
Fig. 2 ERK inhibition abrogates collective alignment of surrounder cells and alters the shape of infected cells (A) L.m.-infected MDCK cells at 24 hpi, treated at 4 hpi with vehicle control (1st column) or 50 μM PD0325901 (2nd column). Rows: phase contrast, L.m., cell nuclei, E-cadherin fluorescence. White outline: infection focus contour. (B) Same images as in (A) with cells in rows color-coded for: cell area (μm2), radial alignment (°) of major cell axis, cell aspect ratio, shape factor (see STAR Methods). (C–F) Box plots of cell area (C), radial alignment (D), cell aspect ratio (E), shape factor (F) of cells originating from uninfected wells, uninfected surrounders and infected cells treated with vehicle control (grayscale) or 50 μM PD0325901 (bluescale). N = 4908 ± 778 single cells were analyzed per condition. Dots show mean of each of N = 3 independent replicates; ANOVA followed by Tukey’s multiple comparisons test: ∗p < 0.05, ∗∗p < 0.01, ∗∗∗p < 0.001, ∗∗∗∗p < 0.0001. See also Figure S2.