IMAGE

Figure 4

ID
ZDB-IMAGE-250228-62
Source
Figures for Zheng et al., 2025
Image
Figure Caption

Figure 4

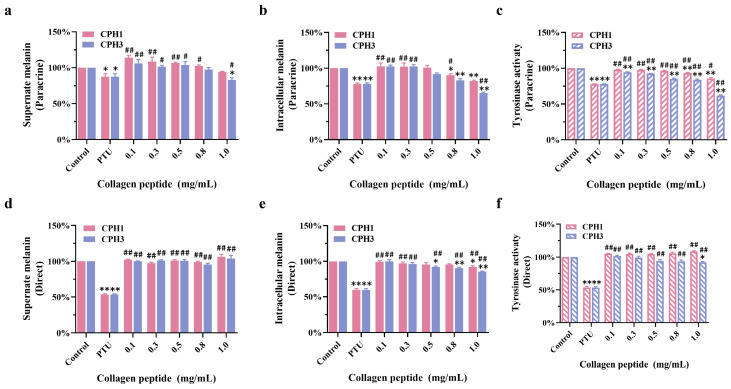
The effects of CPH1 and CPH3 on melanin and TYR. (a) The content of melanin in extracellular supernatant of B16F10 under paracrine action. (b) The content of intracellular melanin in B16F10 under paracrine action. (c) TYR activity in B16F10 under paracrine action. (d) The content of melanin in extracellular supernatant of B16F10 under direct action. (e) The content of intracellular melanin in B16F10 under direct action. (f) TYR activity in B16F10 under direct action. * p < 0.05, ** p < 0.01, versus negative control group. # p < 0.05, ## p < 0.01, versus positive control group (PTU: 1-Phenyl-2-Thiourea, 50 μM), n = 3.

Acknowledgments
This image is the copyrighted work of the attributed author or publisher, and ZFIN has permission only to display this image to its users. Additional permissions should be obtained from the applicable author or publisher of the image. Full text @ Biomolecules