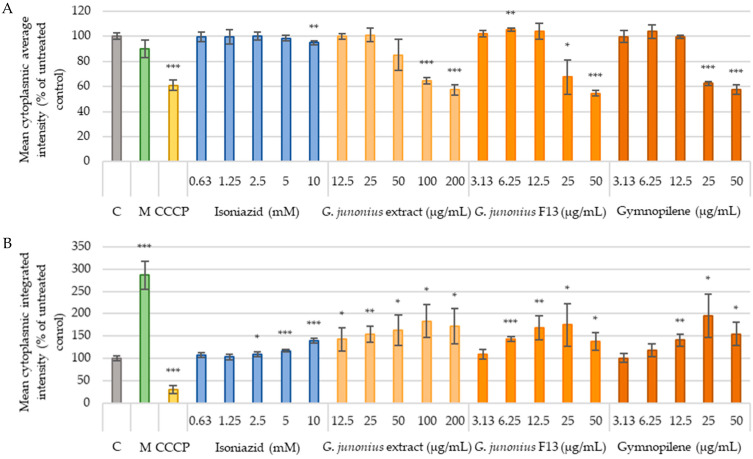
IMAGE

Figure 16

ID
ZDB-IMAGE-250228-29
Source
Figures for Didloff et al., 2025
Image
Figure Caption

Figure 16

TMRE (A) and MitoTracker Green (B) intensity observed after 48-h treatment of C3A cells with G. junonius extract, isolated fraction, and predominant compound gymnopilene in sub-fraction 13.6. Mitochondrial function was determined using the TMRE/MTG staining method. C: untreated control; M: melphalan (50 µM); CCCP: carbonyl cyanide m-chlorophenylhydrazone (25 µM). Data are reported as the mean ± standard deviation of three independent experiments, each performed in triplicate. Significance was determined using the two-tailed Student’s t-test: * p ≤ 0.05, ** p ≤ 0.01, and *** p ≤ 0.005 compared to the untreated control.

Acknowledgments
This image is the copyrighted work of the attributed author or publisher, and ZFIN has permission only to display this image to its users. Additional permissions should be obtained from the applicable author or publisher of the image. Full text @ Antibiotics (Basel)