
Image
|
Figure Caption
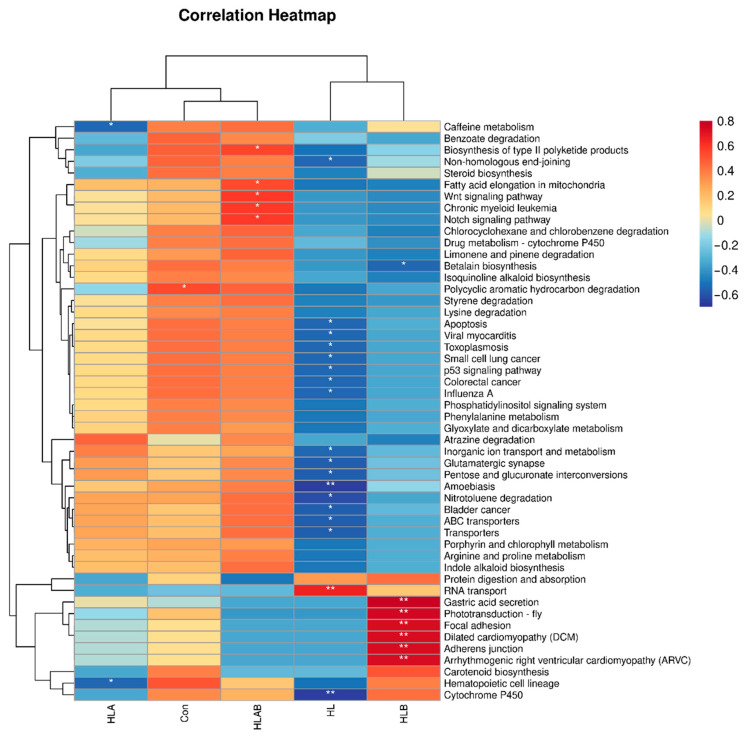
Figure 9
Function prediction analysis of gut microbiota by Spearman correlation analysis. Differences in the relative abundance of level 3 KEGG pathways. Con, control group; HL, high-lipid group; HLA, antibiotic-supplemented high-lipid group; HLB, berberine-supplemented high-lipid group; HLAB, berberine- and antibiotic-supplemented high-lipid group. *
Acknowledgments
This image is the copyrighted work of the attributed author or publisher, and
ZFIN has permission only to display this image to its users.
Additional permissions should be obtained from the applicable author or publisher of the image.
Full text @ Metabolites