IMAGE

Figure 2

ID
ZDB-IMAGE-250226-26
Source
Figures for Zheng et al., 2025
Image
Figure Caption

Figure 2

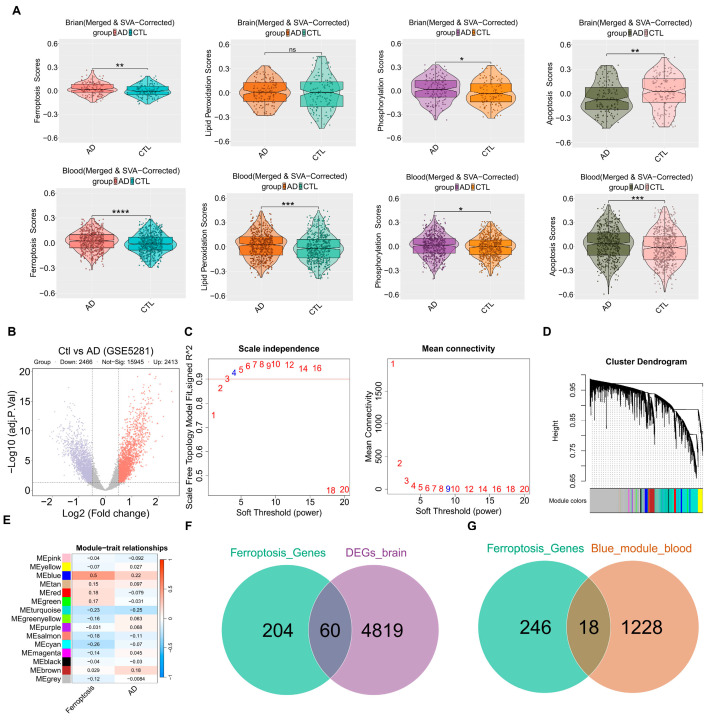
The ferroptosis-related targets from the brain and blood. (A) The Violin plots of GSVA ferroptosis and related pathways scores between the control group and AD group in each dataset. (B) The DEGs volcano plot comparing control and AD groups. (C) Analysis of scale-free fitting index for soft-thresholding powers. (D) Cluster dendrogram. (E) Module–trait correlation heatmap: red represents a positive correlation; blue represents a negative correlation. (F) Venn showing the intersection between ferroptosis genes and DEGs. (G) Venn showing the intersection between ferroptosis genes and the blue module. * p < 0.05; ** p < 0.01; *** p < 0.001; **** p < 0.0001; ns—not significant; AD vs. CTL. AD—Alzheimer’s Disease Group, Ctl—Control Group, DEGs—Differentially Expressed Genes, SVA—Set Variation Analysis.

Acknowledgments
This image is the copyrighted work of the attributed author or publisher, and ZFIN has permission only to display this image to its users. Additional permissions should be obtained from the applicable author or publisher of the image. Full text @ Curr. Iss. Mol. Biol.