
Image
|
Figure Caption
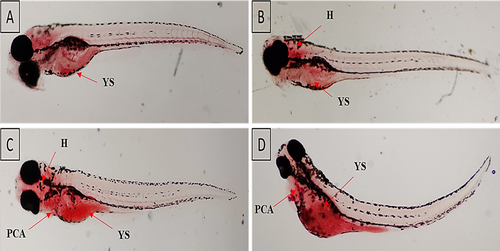
Fig. 3 Showing ORO-stained zebrafish larvae for the lipid accumulation. (A) Control, (B) solvent control, (C) 0.79 mg/L BDE-3 exposed group and (D) 1.59 mg/L BDE-3 exposed group. H, head; PCA, pericardial area; YS, yolk sac.
Acknowledgments
This image is the copyrighted work of the attributed author or publisher, and
ZFIN has permission only to display this image to its users.
Additional permissions should be obtained from the applicable author or publisher of the image.
Full text @ J. Appl. Toxicol.