
|
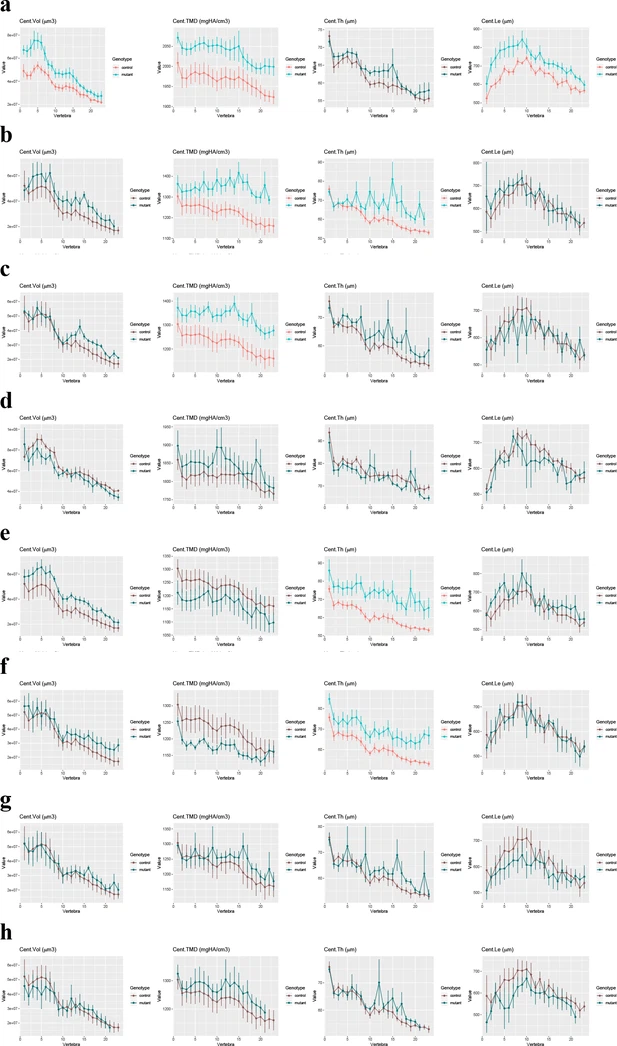
Fig. 4 - Supplemental 2 Quantitative μCT-scanning analysis of the vertebral column of the crispants using FishCuT software. Whole-body μCT-scanning was performed for the evaluation of skeletal structures in the vertebral column. Different bone related parameters are visualized: Tissue Mineral Density (TMD), Volume (Vol), Thickness (Th), and Length (Le). (a) Results of crispants for daam2. (b) Results for crispants for esr1. (c) Results for crispants for sost. (d) Results for crispants for creb3l1. (e) Results for crispants for ifitm5. (f) Results for crispants for sec24d. (g) Results for crispants for serpinf1. (h) Results for crispants for sparc. The first three genes are associated with the pathogenesis of osteoporosis, while the last five are linked to osteogenesis imperfecta. Statistically significant differences were represented with a lighter color scheme for easy visualization.