
Image
|
Figure Caption
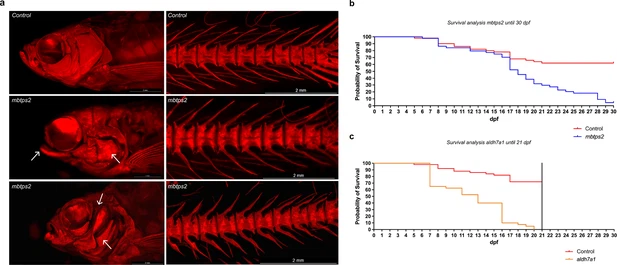
Fig. 3 ARS images of mbtps2 crispants and survival analysis of aldh7a1 and mbtps2 crispants. (a) ARS images of control fish and crispants for mbtps2, showing severe craniofacial abnormalities (arrows). (b) Survival curve of controls and crispants for mbtps2, showing a reduction in survival starting from 17 dpf. (c) Survival curve of controls and crispants for aldh7a1, showing a reduction in survival starting from 7 dpf.
Acknowledgments
This image is the copyrighted work of the attributed author or publisher, and
ZFIN has permission only to display this image to its users.
Additional permissions should be obtained from the applicable author or publisher of the image.
Full text @ Elife