
|
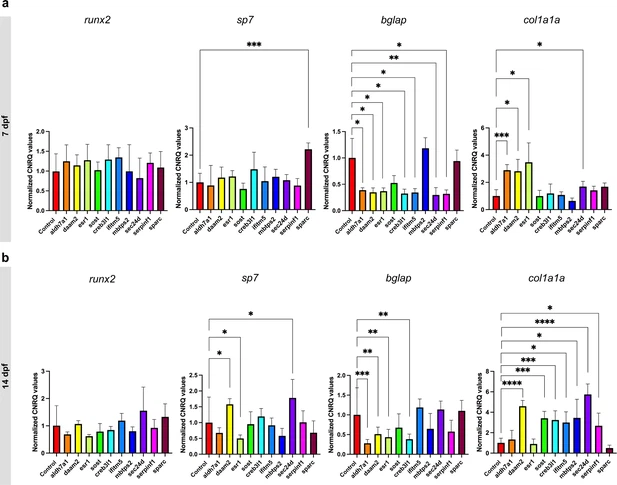
Fig. 2 RT-qPCR expression analysis of runx2, sp7, bglap and col1a1a in crispants at 7 (a) and 14 dpf (b) and their respective controls, normalized according to the controls (normalization = individual values crispant (or control) / mean control). The first four genes are associated with the pathogenesis of osteoporosis, while the last six are linked to osteogenesis imperfecta. Statistical significance is evaluated using the Mann-Whitney U test on non-normalized data and significant differences were visualized using an asterix (*=p ≤ 0.05; **=p ≤ 0.01; ***=p ≤ 0.001; ****=p ≤ 0.0001). Error bars show the standard deviation of non-normalized data.