
Image
|
Figure Caption
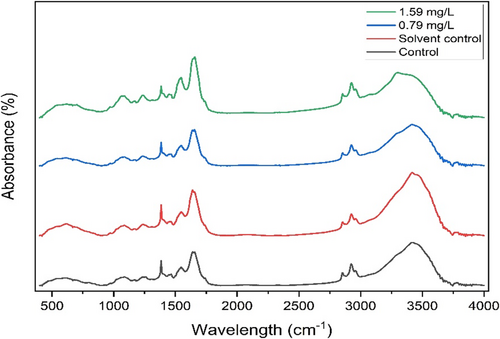
Fig. 6 The representative mean FT-IR spectra of the control and BDE-3 exposed zebrafish larvae in the 400–4000 cm−1 wavelength region.
Acknowledgments
This image is the copyrighted work of the attributed author or publisher, and
ZFIN has permission only to display this image to its users.
Additional permissions should be obtained from the applicable author or publisher of the image.
Full text @ J. Appl. Toxicol.