IMAGE

Figure 9

ID
ZDB-IMAGE-250215-61
Source
Figures for Xia et al., 2025
Image
Figure Caption

Figure 9

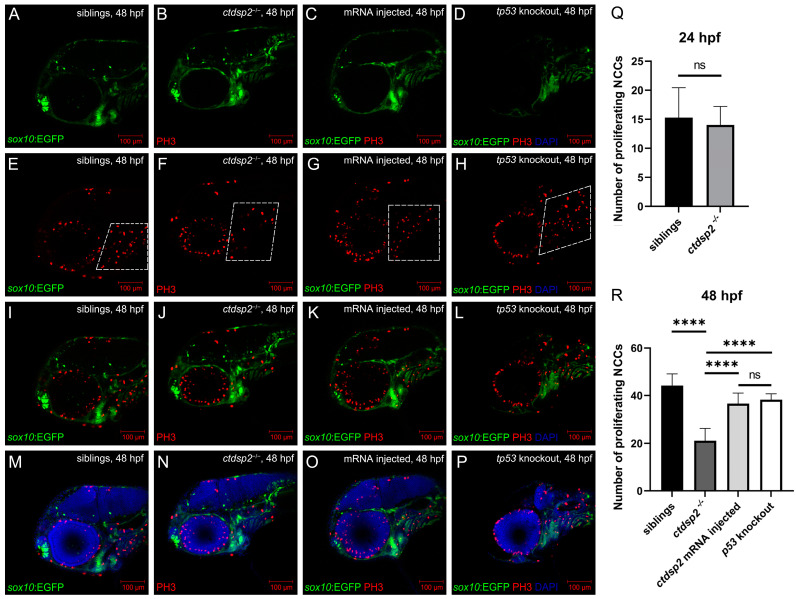
Immunofluorescence results depicting NCC proliferation through antiphosphohistone H3 (PH3) staining in (A,E,I,M) control siblings, (B,F,J,N) ctdsp2−/− mutants, (C,G,K,O) ctdsp2−/− embryos injected with ctdsp2 mRNA, and (D,H,L,P) tp53-knockout ctdsp2−/− embryos at 48 h post-fertilization (hpf). The merged images highlight the anti-PH3 signals in the NCCs located in the pharyngeal arch region, marked by a dotted box. (Q,R) Number of proliferating NCCs among each group. Note: Immunofluorescence experiments were performed in triplicate, statistical analyses were carried out using 3 randomly picked embryos in each group, and statistical significance was assessed by unpaired t-tests, with p < 0.05 considered statistically significant; **** p < 0.0001.

Acknowledgments
This image is the copyrighted work of the attributed author or publisher, and ZFIN has permission only to display this image to its users. Additional permissions should be obtained from the applicable author or publisher of the image. Full text @ Int. J. Mol. Sci.