
Fig. 4 - Supplemental 1
- ID
- ZDB-IMAGE-250214-65
- Source
- Figures for Meissner-Bernard et al., 2025
|
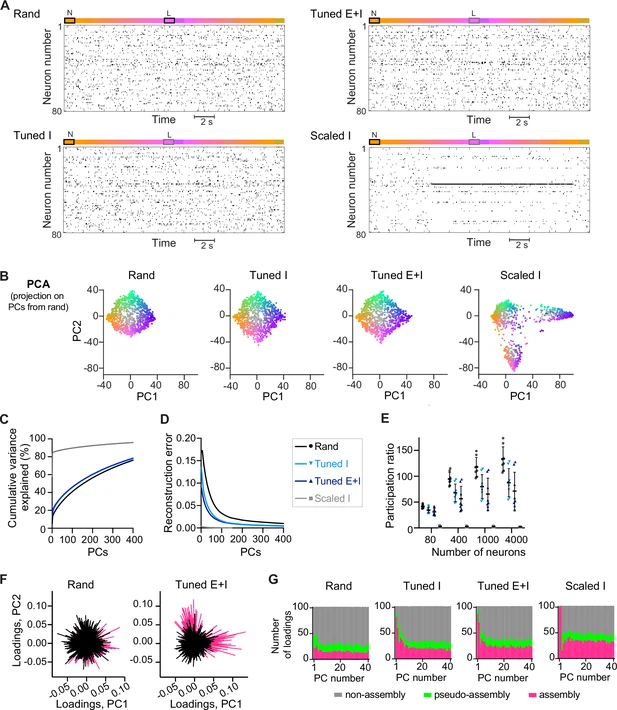
Fig. 4 - Supplemental 1 Transformations and dimensionality of activity patterns: additional results. (A) Spike raster of 80 E neurons in response to a trajectory within the odor subspace (Figure 4A) including one pure learned and one pure novel odor. (B) Projection of activity patterns representing the odor subspace (Figure 4A) onto the first two principal components (PCs) of the corresponding rand networks (representative examples of one network each). (C) Scree plot for the principal component analysis (PCA) results shown in Figure 4D. (D) Error in the reconstruction of odor-evoked activity patterns as a function of the number of PCs. Euclidean distances between all pairs of activity patterns were calculated in the full-dimensional state space (Df) and in reduced-dimensional embedding spaces (Dl). The reconstruction error was defined as 1 – (correlation between Df and Dl). (E) Participation ratio of the neural activity sampled from different numbers of neurons (50 iterations). (F) Loading plot: Contribution of neurons to the first two PCs of a rand and a Tuned E+I network (Figure 4D). Each line represents one neuron and neurons that are part of the assemblies representing the two learned odors are color-coded in magenta. (G) For each network and PC, the 100 E neurons with the highest absolute loadings were selected and grouped into three categories: neurons part of the two assemblies representing the learned odors, neurons part of the two ‘pseudo-assemblies’ representing the two novel odors, and the remaining neurons (non-assembly).