
|
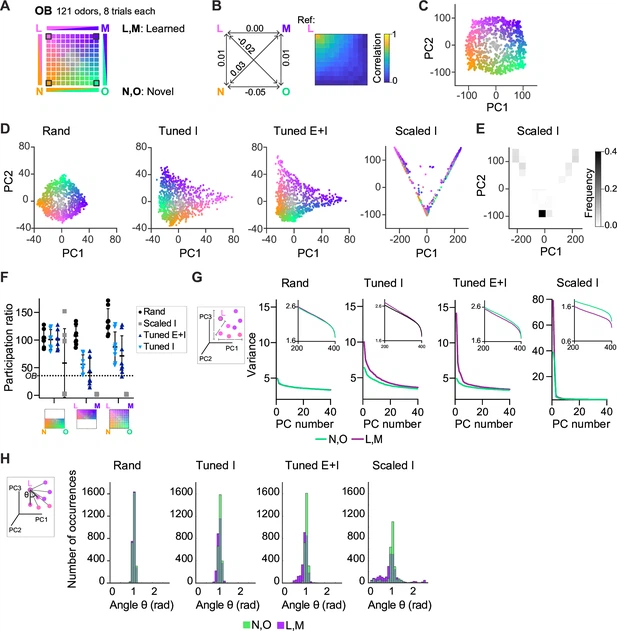
Fig. 4 Geometry of odor representations in pDpsim. (A) Odor subspace delineated by two learned (L, M) and two novel (N, O) pure odors at the vertices of a virtual square. Pixels within the square represent odor mixtures. (B) Left: Pearson correlations between olfactory bulb (OB) activity patterns defining pure odors. Right: Correlation between one pure odor (L; top left vertex) and all other odors. The odor from one vertex gradually morphs into the odor from another vertex. (C) Projection of activity patterns in the OB onto the first two principal components (PCs). Colors represent patterns in the odor subspace as shown in (A, D). Projection of activity patterns in pDpsim in response to the odor subspace onto the first two PCs. Representative examples of different pDp networks. (E) Density plot showing distribution of data points and demonstrating clustering at distinct locations in PC space for Scaled I networks. (F) Quantification of dimensionality of neural activity by the participation ratio: activity evoked by novel odors and related mixtures (left), activity evoked by learned odors and related mixtures (center), and activity evoked by all stimuli (right). Each data point represents one network (n = 8, mean ± SD); dotted line represents the participation ratio of OB activity. (G) Variance along the first 40 PCs extracted from activity patterns in different networks. Insets: Variance along PCs 200–400. (H) Angles between edges connecting a pure odor response and related versions thereof (inset). The analysis was performed using the first 400 PCs, which explained >75% of the variance in all networks. n = 168 angles per pure odor in each of 8 networks (Methods). Similar results were obtained in the full-dimensional space.