
|
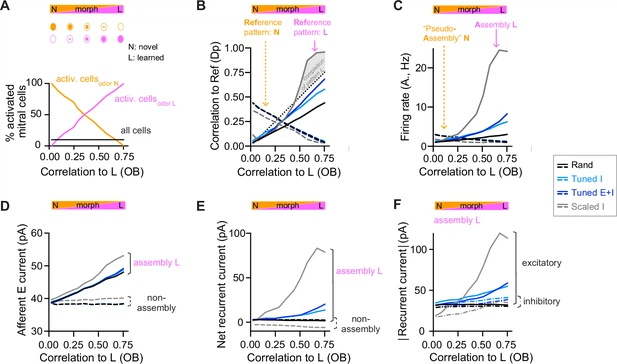
Fig. 3 Changes of output activity to gradual modifications of inputs. (A) Morphing of a novel odor N into a learned odor L. Morphed odors were generated by gradually changing the fractions of activated mitral cells defining odors N or L. The x-axis indicates the similarity of a morphed odor to odor L, here quantified by the correlation between the olfactory bulb (OB) activity patterns representing the morphed and the learned odors (same x-axis in all panels). (B) Pearson correlation between activity patterns evoked by a morphed odor and a learned odor in pDpsim as a function of the corresponding correlations in the OB (full line). The dashed line shows the correlation to the novel odor instead of the learned odor. A signature of pattern completion is a steep increase in the correlation between activity patterns representing a morphed and a learned odor in pDpsim, often exceeding the OB input correlation (gray shaded area). (C) Firing rates in response to morphed odors averaged across assembly neurons (learned odor, full line) or pseudo-assembly neurons (novel odor, dashed line) as a function of similarity between the presented odor and learned odor L (see A). (D) Excitatory input from the OB averaged over assembly neurons or non-assembly neurons. (E) Sum of inhibitory and excitatory currents evoked by other pDpsim neurons (recurrent input), averaged over assembly or non-assembly neurons. (F) Absolute inhibitory and excitatory recurrent currents averaged over assembly neurons. (B–F) Averages over eight networks.