
Fig. 2 - Supplemental 1
- ID
- ZDB-IMAGE-250214-60
- Source
- Figures for Meissner-Bernard et al., 2025
|
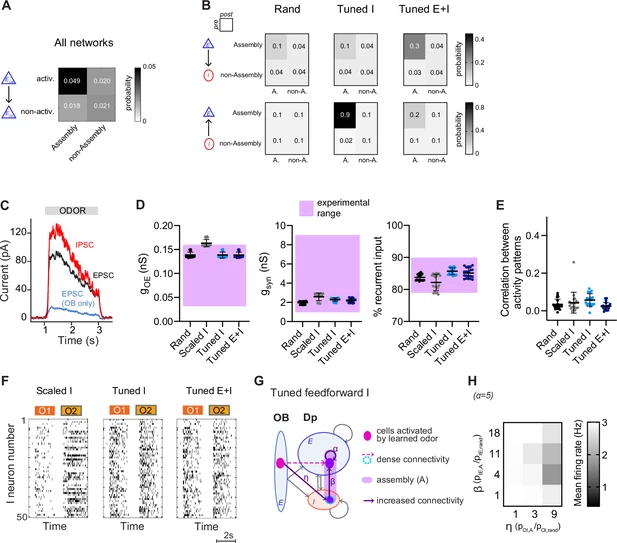
Fig. 2 - Supplemental 1 Structured networks reproduce key features of pDp. (A) Connection probability between activated (activ.) or non-activated (non-activ.) mitral cells and assembly or non-assembly neurons. (B) Connection probability between classes of E and I neurons in a rand, a Tuned I, and a Tuned E+I network. (C) EPSCs and IPSCs in a Tuned I network as observed in a hypothetical voltage clamp recording, averaged across neurons and odors. An equivalent plot for a rand network is shown in Figure 1E. (D, E) Values of observables for rand networks (same as Figure 1G, H) and different structured networks (Scaled I, Tuned I, and Tuned E+I). (F) Spike raster plots showing responses of 50 I neurons to 2 odors (O1: novel odor; O2: learned odor) in a Scaled I and the corresponding Tuned networks (same neurons and odors in the corresponding rand network are shown in Figure 1C). (G) Network with increased connectivity between the E assembly neurons (α = 5) and the 25 I neurons that are most densely connected to the mitral cells activated by a given odor. (H) Mean firing rate of the network in (E) in response to learned odors as a function of connection probability. Activity could not be stabilized efficiently by selecting I neurons based on their afferent connectivity.