
|
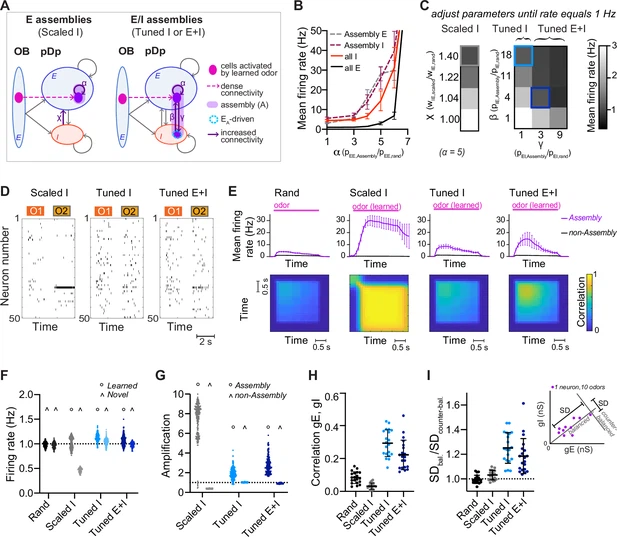
Fig. 2 Networks with neuronal assemblies (memories). (A) Schematic of assemblies. Each assembly contains the 100 E neurons that are most densely connected to the mitral cells activated by a given odor. Connection probability between these E neurons is increased by a factor α. In Scaled I networks, weights of all I-to-E synapses are increased by a factor χ. In Tuned networks, the 25 I neurons that are most densely connected to the 100 E neurons are included in each assembly. In Tuned I networks, the probability of I-to-E connections within the assembly is increased by a factor β. In Tuned E+I networks, probabilities of I-to-E and E-to-I connectivity within the assembly are increased by factors β and γ, respectively. n = 20 networks with 15 assemblies each were simulated for each group. (B) Firing rates averaged over all E or I neurons (full lines) and over all assembly neurons (dashed lines) as a function of α (mean ± SD across 20 networks). (C) Mean E neuron firing rates of Scaled (left) and Tuned (right) networks in response to learned odors as a function of connection strength and probability, respectively. Squares depict parameters used in following figures unless stated otherwise. (D) Spike raster plots showing responses of 50 E neurons to 2 odors (O1: novel odor; O2: learned odor) in a Scaled I and the corresponding Tuned networks (same neurons and odors in the corresponding rand network are shown in Figure 1C). (E) Top: Mean firing rates in response to learned odors as a function of time, averaged across assembly or non-assembly neurons. Bottom: Mean correlation between activity patterns evoked by a learned odor at different time points during odor presentation. Correlation coefficients were calculated between pairs of activity vectors composed of the mean firing rates of E neurons in 100 ms time bins. Activity vectors were taken from the same or different trials, except for the diagonal, where only patterns from different trials were considered. The pink bar indicates odor presentation. (F) Mean firing rate in response to learned odors or novel odors. Each data point represents one network–odor pair (n = 20 networks, 10 odors). (G) Amplification within and outside assemblies, calculated as the ratio between the mean firing rates in response to learned odors averaged over the same populations of neurons in a given structured network (Scaled I, Tuned I, or Tuned E+I) and the corresponding rand network. Each data point represents one network–odor pair. (H) Quantification of co-tuning by the correlation between time-averaged E and I conductances in response to different odors, average across neurons. Each data point corresponds to one network (n = 20). Mean ± SD. (I) Quantification of co-tuning by the ratio of dispersion of joint conductances along balanced and counter-balanced axes (inset; Methods; n = 20 networks).