
|
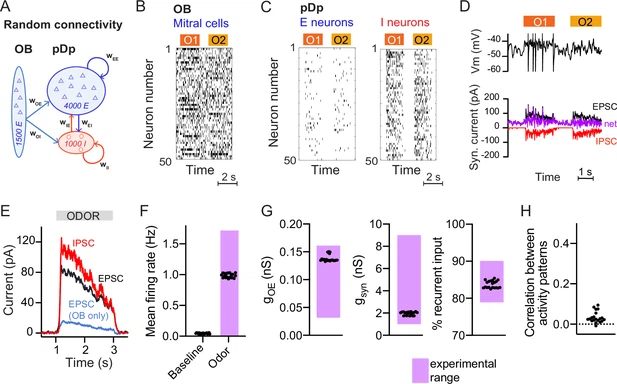
Fig. 1 Spiking network model of pDp. (A) Schematic of pDpsim. OB, olfactory bulb; E, excitatory; I, inhibitory neurons. (B) Spike raster of a random subset of 50 mitral cells in the OB representing 2 odors (O1 and O2). During odor stimulation, firing rates of 10% of mitral cells were increased and firing rates of 5% of mitral cells were decreased (baseline rate, 6 Hz). (C) Spike raster of random subsets of 50 E and I neurons in response to 2 odors. (D) Representative membrane potential trace (top) and excitatory (EPSC, black) and inhibitory (IPSC, red) currents (bottom) in one excitatory neuron in response to two odors. Purple trace shows net current (EPSC + IPSC). (E) Odor-evoked inhibitory (red) and excitatory (black and blue) currents as measured in a hypothetical voltage clamp experiment (conductance multiplied by 70 mV, the absolute difference between holding potential and reversal potential; Rupprecht and Friedrich, 2018). Representative example of one network, averaged across neurons and odors. (F–H) Measured values of the observables used to match pDpsim to experimental data. Each dot represents one network (average over 10 odors); n = 20 networks. Pink shading shows the experimentally observed range of values. (F) Baseline and odor-evoked population firing rate. (G) Left: gOE is the synaptic conductance in E neurons contributed by afferents from the OB during odor stimulation. Middle: gsyn is the total odor-evoked synaptic conductance. Right: % recurrent input quantifies the percentage of E input contributed by recurrent connections during odor stimulation. (H) Correlation coefficient between odor-evoked activity patterns in pDpsim. The dotted line indicates the mean correlation between odor patterns in the OB.