
|
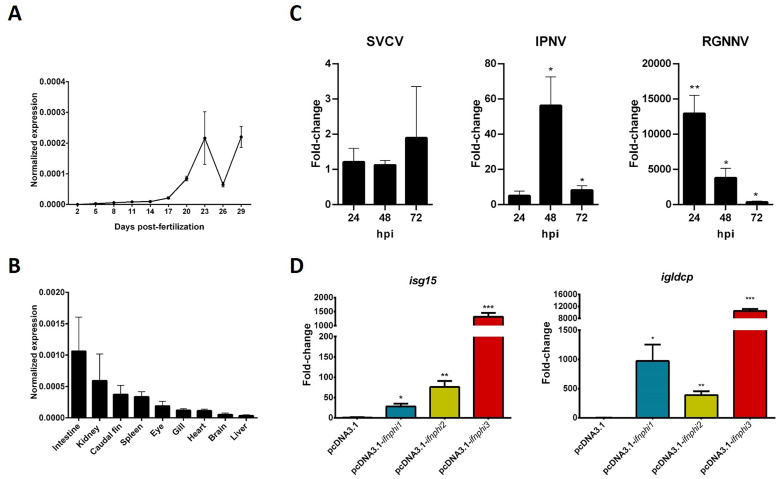
Fig. 3 Expression patterns of the zebrafish igldcp gene. Basal expression of igldcp in zebrafish A) during ontogeny and B) in different tissues from healthy adult zebrafish. C) Modulation of igldcp expression in zebrafish larvae (3 dpf) infected with SVCV, IPNV or RGNNV at 24, 48 and 72 hpi. D) Induction of igldcp and isg15 expression in zebrafish larvae at 72 h after the microinjection of the expression plasmids pcDNA3.1-ifnphi1, pcDNA3.1-ifnphi2 and pcDNA3.1-ifnphi3. The expression level of igldcp was normalized to the expression of the 18S rRNA gene. The fold change in expression was calculated by standardizing the normalized data to the control group. The graphs present the means ± SEMs of 3–5 independent biological replicates. Statistically significant differences are displayed as follows: ∗∗∗ (0.0001 < p < 0.001), ∗∗ (0.001 < p < 0.01) or ∗ (0.01 < p < 0.05).