
Fig. 1 - Supplemental 1
- ID
- ZDB-IMAGE-250211-9
- Publication
- Hollander-Cohen et al., 2024 - The satiety hormone cholecystokinin gates reproduction in fish by controlling gonadotropin secretion
- All Figures
- Figures for Hollander-Cohen et al., 2024
|
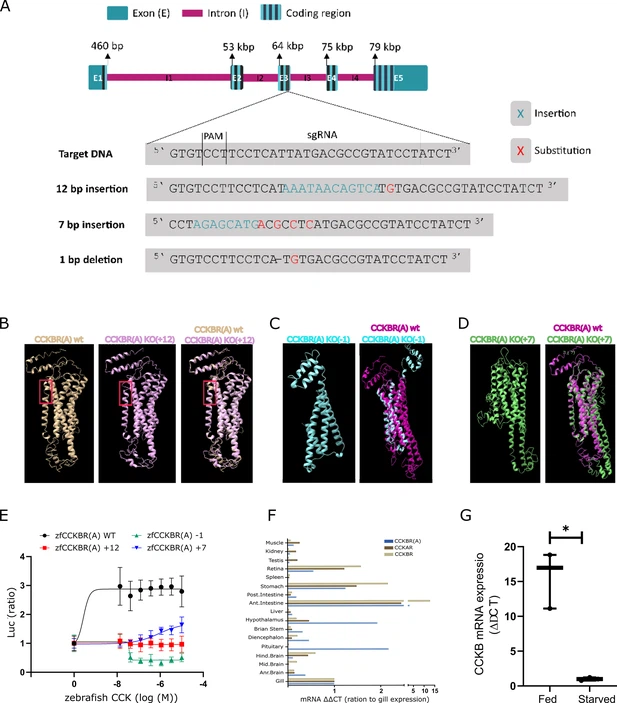
Fig. 1 - Supplemental 1 Supporting evidence for CCKBRA activity, expression and loss of function in the CRISPR mutants. (A) The three identified mutations induced by gRNA number two. The 7 bp insertion and 1 bp depletion created a frameshift that disrupted the translation of the RNA, while the 12 bp insertion added four amino acids that disrupted the structure of the CCKR transmembrane domain of the receptor. (B) The protein structure of the CCKR with the +12 insertion (pink) compared to the WT CCKR structure (brown). The +12 addition resulted in the incorporation of four additional amino acids, specifically two asparagine, one serine, and one histidine, at residue number 187–191. Notably, this mutation-induced alteration is evident in the figure, where the WT CCKR displays an intact alpha helix structure and the mutant cholecystokinin (CCK) receptor reveals a loss of this structural element. (C) The protein structure of the CCKR with a –1 nucleotide depletion (cyan) results in a frameshift, resulting in the addition of a premature stop codon at residue 187, terminating the translation at this point, compared to the 442 amino acids in the WT CCKR (magenta). (D) The protein structure of the CCKR with the addition of seven nucleotides at residue 174 (green), resulting in a frameshift and the introduction of a stop codon, thus yielding a receptor composed of 184 amino acids, contrasting the 442 amino acids in the WT receptor (magenta). All structures were created using the I-TASSER protein structure algorithm. (E) The CCK ligand stimulated WT CCKR but not the mutated receptors in a COS-7 reporter assay. Data are presented as mean ± SEM of a representative experiment performed in triplicate. (F) Expression levels by real-time polymerase chain reaction (PCR) of CCKAR, CCKBR, and CCKBRA in various tissues of Nile tilapia Fish. The relative expression of mRNA in each tissue was normalized to the expression levels of ef1a by the comparative threshold cycle method, all expression levels were then normalized to the expression levels of the gill for each gene, respectively. (G) CCKB mRNA expression in the brain is significantly down-regulated in starved fish compared to fed fish (n=3, Paired t-test, *p<0.05).