
Fig. 5
- ID
- ZDB-IMAGE-250211-17
- Genes
- Publication
- Hollander-Cohen et al., 2024 - The satiety hormone cholecystokinin gates reproduction in fish by controlling gonadotropin secretion
- All Figures
- Figures for Hollander-Cohen et al., 2024
|
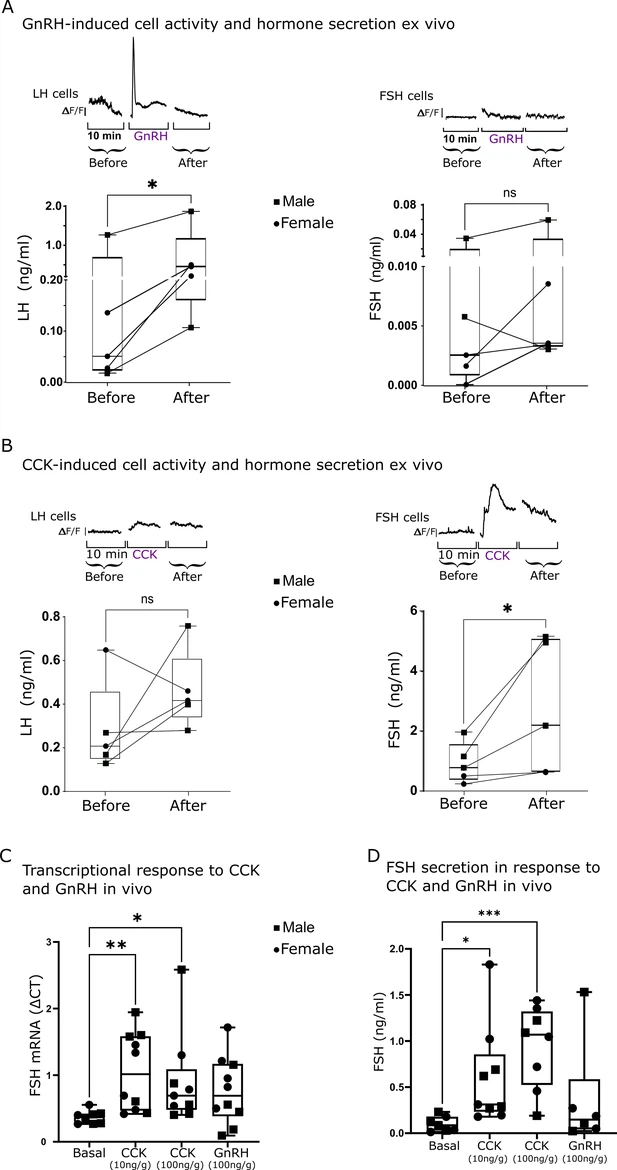
Fig. 5 The stimulated calcium activity of luteinizing hormone (LH) and follicle-stimulating hormone (FSH) cells is associated with hormone secretion. (A and B) Top: Graphs showing the mean calcium trace of 10 LH cells (left panel) or FSH cells (right panel) from consecutive imaging sessions before, during, and after the application of the stimulus (gonadotropin-releasing hormone, GnRH or cholecystokinin, CCK). Bottom: Secretion of LH or FSH before or after GnRH (A) or CCK (B) stimulation (dots from the same imaged pituitaries are connected with a line; n=5, paired t-test, *p<0.05). (C) FSH mRNA transcription in the pituitary 2 hr after injection of CCK or GnRH into live fish (n=10, 5 females and 5 males, see Figure 5—figure supplement 1 for LH expression; one-way ANOVA, *p<0.05, **p<0.01). (D) FSH plasma levels after CCK or GnRH injection into live fish (n=10, 5 females and 5 males), (one-way ANOVA, *p<0.05, ***p<0.001).