IMAGE

Figure 7

ID
ZDB-IMAGE-250210-58
Source
Figures for Zheng et al., 2025
Image
Figure Caption

Figure 7

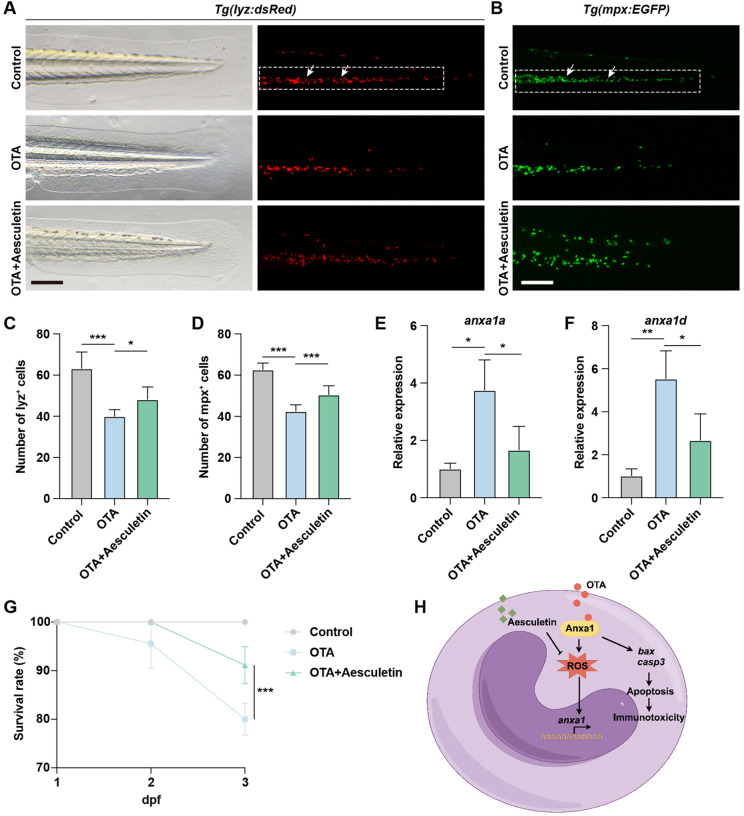
Aesculetin recued the immunotoxicity induced by OTA exposure. (A, B) Representative images of control, 25 ng/mL OTA and 25 ng/mL OTA + 20 μg/mL aesculetin-treated Tg(lyz:dsRed)(A) and Tg(mpx:EGFP)(B) transgenic zebrafish larvae at 3 dpf. The white dashed rectangle represents the CHT region and the white arrows represent the neutrophils. Scale bar, 100 μm. (C, D) Statistical analysis of the number of neutrophils in Tg(lyz:dsRed)(C) and Tg(mpx:EGFP)(D) transgenic zebrafish larvae. One-way ANOVA-Dunnett test, *p < 0.05, ***p < 0.001. Error bar represents standard deviation. (E, F) qRT-PCR results showing the expression level of anxa1a(E) and anxa1d(F) in control, 25 ng/mL OTA treated and 25 ng/mL OTA + 20 μg/mL aesculetin treated zebrafish larvae at 3 dpf. One-way ANOVA-Dunnett test, *p < 0.05, **p < 0.01. Error bar represents standard deviation. (G) Survival rate of zebrafish larvae exposed to 0, 25 ng/mL OTA and 25 ng/mL OTA + 20 μg/mL aesculetin at 2 dpf and 3 dpf. One-way ANOVA-Dunnett test, ***p < 0.001. Error bar represents standard deviation. (H) Schematic diagram of OTA-induced immunotoxicity in zebrafish.

Acknowledgments
This image is the copyrighted work of the attributed author or publisher, and ZFIN has permission only to display this image to its users. Additional permissions should be obtained from the applicable author or publisher of the image. Full text @ Front Immunol