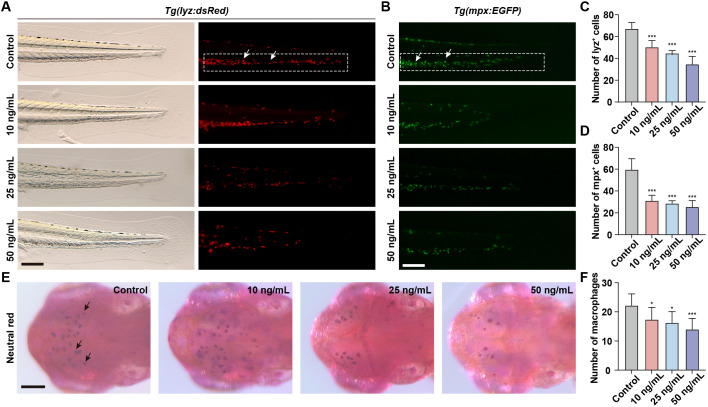
OTA impaired the formation of innate immune cells in zebrafish larvae. (A, B) Representative images of control and OTA-treated Tg(lyz:dsRed)(A) and Tg(mpx:EGFP)(B) transgenic zebrafish larvae at 3 dpf. The white dashed rectangle represents the CHT region and the white arrows represent the neutrophils. Scale bar, 100 μm. (C) Representative neutral red staining results of control and OTA-treated zebrafish larvae at 3 dpf. The black arrows represent neutral red labeled macrophages. Scale bar, 100 μm. (D–F) Statistical analysis of the number of neutrophils (A, B) and macrophages (C). One-way ANOVA-Dunnett test, *p < 0.05, ***p < 0.001. Error bar represents standard deviation.
Acknowledgments
This image is the copyrighted work of the attributed author or publisher, and
ZFIN has permission only to display this image to its users.
Additional permissions should be obtained from the applicable author or publisher of the image.
Full text @ Front Immunol
Your Input Welcome
Thank you for submitting comments. Your input has been emailed to ZFIN curators who may contact you if
additional information is required.
Oops. Something went wrong. Please try again later.