
Image
|
Figure Caption
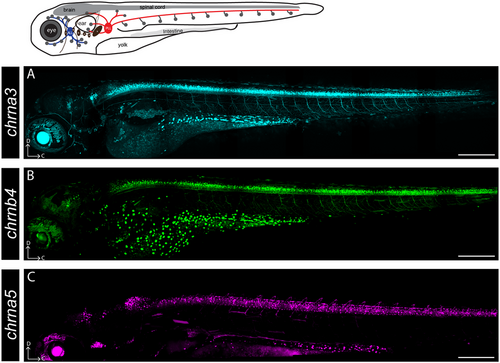
Fig. 1 Overview of the expression of chrna3tdTomato, chrnb4eGFP, and chrna5tdTomato at 5 dpf. (A–C) Lateral view of the zebrafish larvae labeled by chrna3 (cyan) chrnb4 (green) and chrna5 (magenta) expression. Scale bars equal 250 µm. C, caudal; D, dorsal.
Acknowledgments
This image is the copyrighted work of the attributed author or publisher, and
ZFIN has permission only to display this image to its users.
Additional permissions should be obtained from the applicable author or publisher of the image.
Full text @ Dev. Neurobiol.