
|
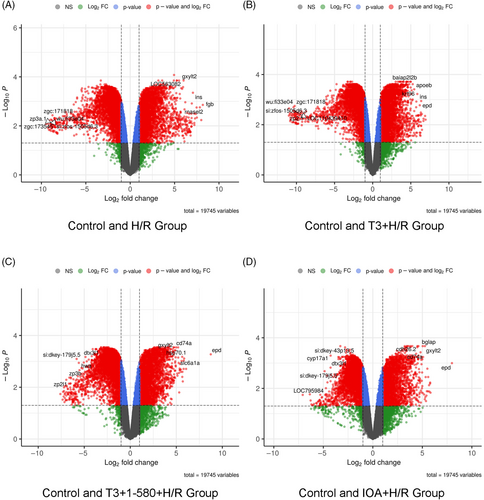
Fig. 4 Volcano plots showing DEGs of identified during microarray analysis. In the plot, each point represents a gene, with the x-axis showing the fold change in expression and the y-axis showing the statistical significance of the difference, represented as the negative logarithm of the p value. The criteria of DEG was |logFC| >1 and p value <0.05. Red dots represent genes or features that are significantly up-regulated or down-regulated in a treatment group in comparison with control. Blue dots represent genes with p value <0.05 but |logFC| <1. Green dots represent genes with |logFC| >1 but p value >0.05. Grey dots represent genes with |logFC| <1 and p value >0.05. Data are shown as comparison between (A) Control and H/R Group, (B) Control and T3 + H/R Group, (C) Control and T3 + 1–580 + H/R Group; (D) Con and IOA+ H/R Group.