
Image
|
Figure Caption
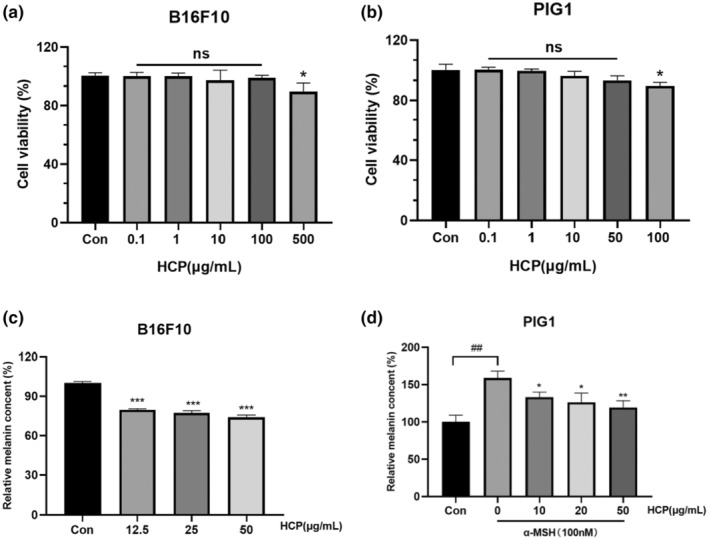
FIGURE 1
(a, b) Effect of HCP on the viability of B16F10 and PIG1 cells. B16F10 and PIG1 cells were subjected to treatment with HCP at several concentrations for a duration of 24 h, and the CCK8 assay was used to measure cell viability. (c, d) Effect of HCP on melanin synthesis in B16F10 and PIG1 cells. Percentages in treatment groups were calculated relative to those in the control (Con) group. Data are displayed in the form of mean ± SD (
Acknowledgments
This image is the copyrighted work of the attributed author or publisher, and
ZFIN has permission only to display this image to its users.
Additional permissions should be obtained from the applicable author or publisher of the image.
Full text @ Int J Cosmet Sci