
|
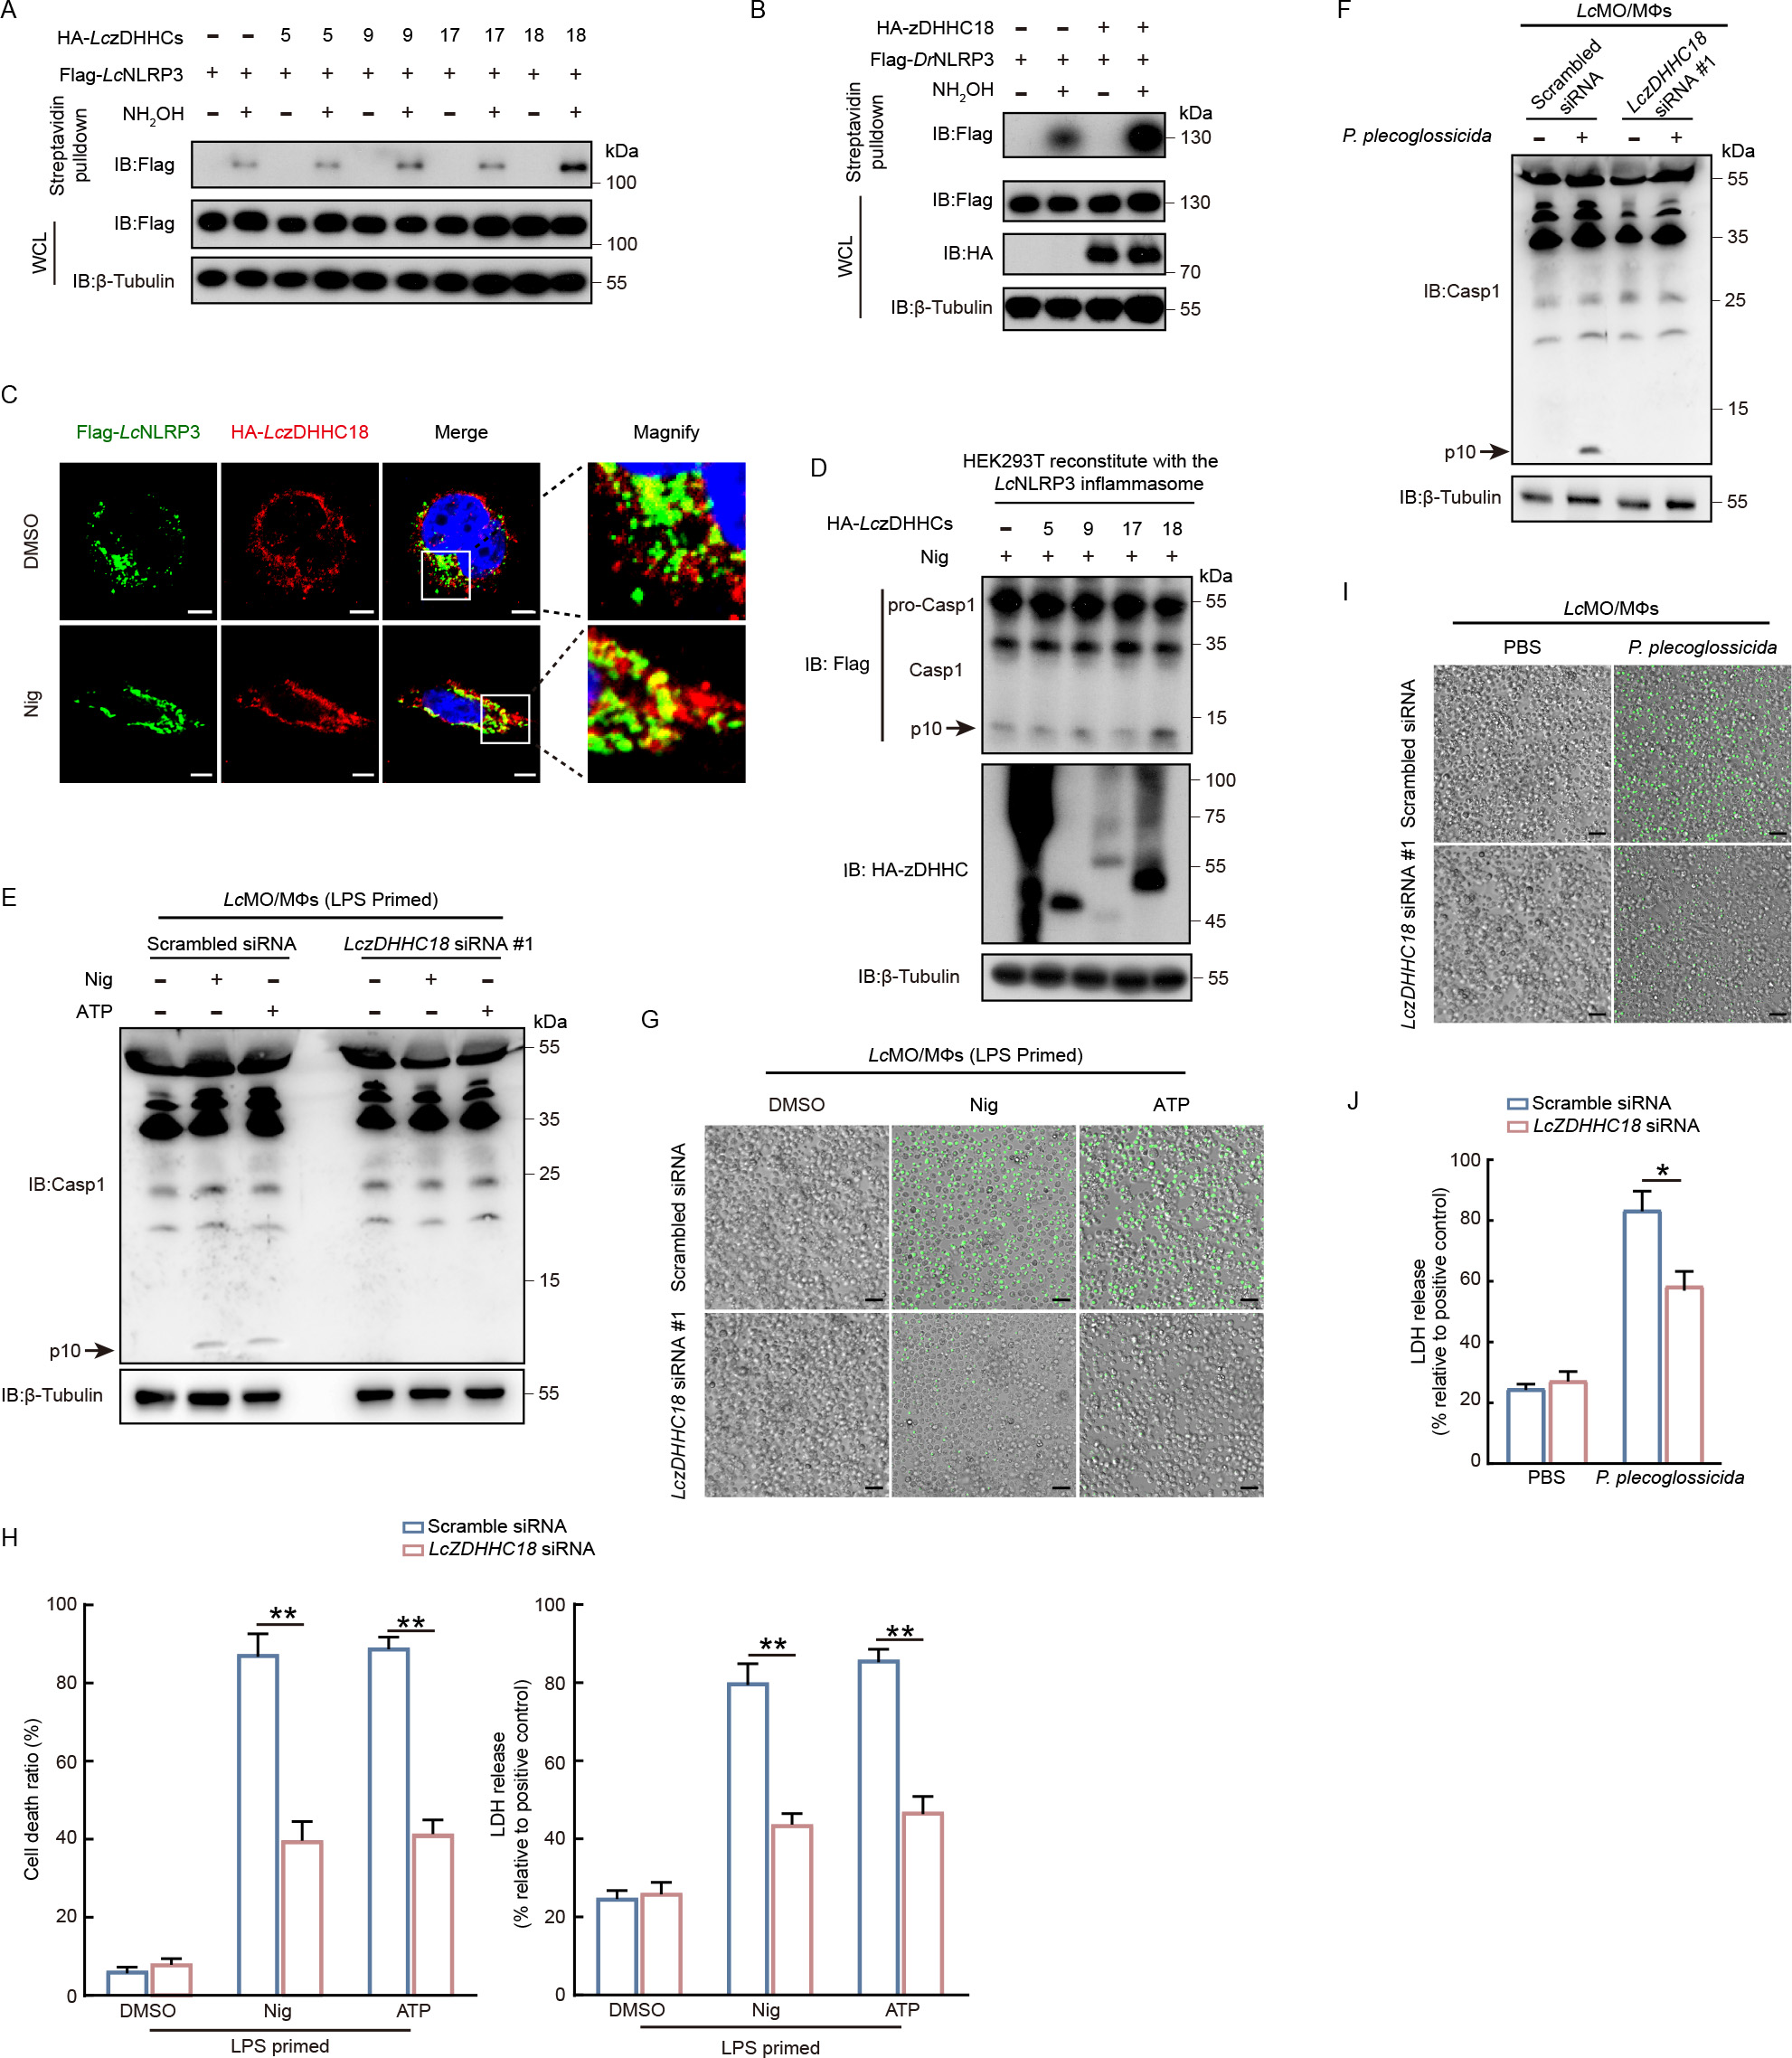
Fig. 4 zDHHC18 serves as the primary palmitoyl transferase mediating teleost NLRP3 palmitoylation Α: ABE assay of palmitoylation levels of Flag-LcNLRP3 in HEK293T cells overexpressing Flag-LcNLRP3 alone, or with HA-LczDHHC5/9/17/18, with or without hydroxylamine. B: ABE assay of palmitoylation levels of Flag-DrNLRP3 in HEK293T cells overexpressing Flag-DrNLRP3 alone or with HA-LczDHHC18, with or without hydroxylamine. C: Immunofluorescence images showing colocalization of LcNLRP3 and LczDHHC18 in overexpressed HEK293T cells, with or without nigericin stimulation. Blue indicates nuclear staining by DAPI. Scale bars: 5 μm. D: Caspase-1 processing (p10) in nigericin (40 μmol/L)-stimulated HEK293T cells overexpressing LcNLRP3 inflammasome components, with or without HA-LczDHHC5/9/17/18. E, F: Caspase-1 processing (p10) upon NLRP3 inflammasome activation in LcMO/MΦs transfected with scrambled siRNA or zDHHC18 siRNA. Cells were primed with LPS and stimulated with nigericin or ATP for 60 min (E) or infected with P. plecoglossicida (F) for inflammasome activation. G: Live cell imaging of pyroptosis of cells from (E) using SYTOX Green nucleic acid staining. Scale bars: 50 μm. H: Quantification of percentage of cells showing positive SYTOX Green signals and levels of LDH release in (E). Mean±SD, n=3, **: P<0.01. Data were analyzed using an unpaired two-tailed Student’s t-test. I: Live cell imaging of pyroptosis of cells from (F) using SYTOX Green nucleic acid staining. Scale bars: 50 μm. J: LDH release levels in cells in (F). Mean±SD, n=3, *: P<0.05. Data were analyzed using an unpaired two-tailed Student’s t-test. All immunofluorescence images are representative of three independent experiments.