IMAGE

Fig 3

ID
ZDB-IMAGE-250203-11
Source
Figures for Wang et al., 2024
Image
Figure Caption

Fig 3

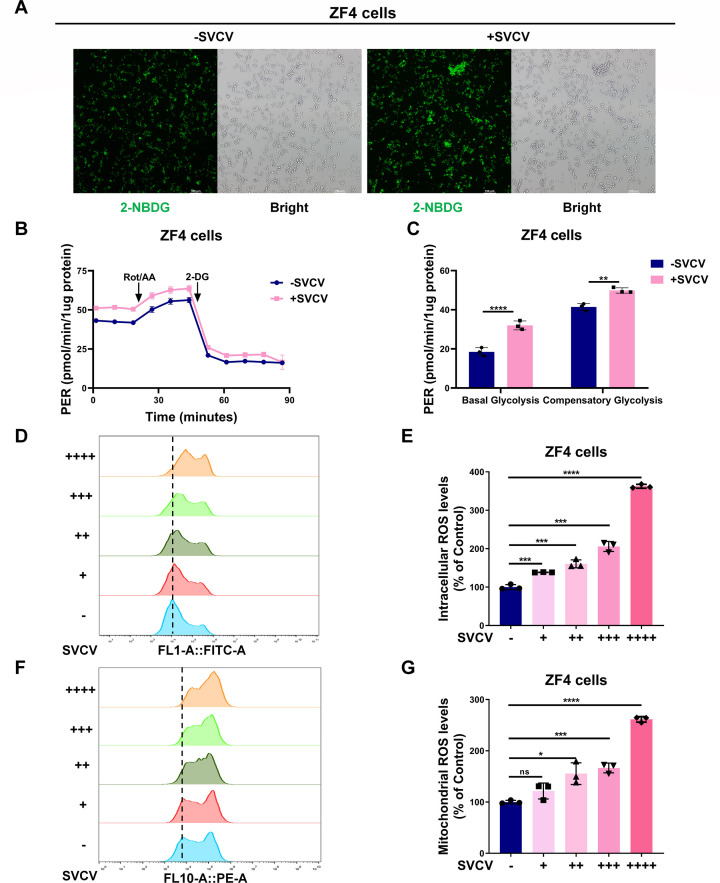
SVCV infection enhances glucose uptake, glycolytic rate, and intracellular and mitochondrial ROS levels in ZF4 cells. (A) Glucose uptake in ZF4 cells with or without SVCV infection as detected by uptake of the fluorescent glucose analog 2-NBDG using fluorescence microscopy (n = 3). Scale bar = 100 µm. (B, C) Proton efflux rate (PER) changes in ZF4 cells (n = 3) with or without SVCV infection as measured using Seahorse XFe24 Extracellular Flux Analyzer (B). Statistical analysis of basal glycolysis and compensatory glycolysis were shown in (C). (D, E) The levels of intracellular ROS in ZF4 cells infected with SVCV with increasing doses were detected by flow cytometry analysis. Quantitation of intracellular ROS levels in (D) was shown in (E). (F, G) The levels of mitochondrial ROS in ZF4 cells infected with SVCV with increasing doses were detected by flow cytometry analysis. Quantitation of mitochondrial ROS levels in (F) was shown in (G).

Acknowledgments
This image is the copyrighted work of the attributed author or publisher, and ZFIN has permission only to display this image to its users. Additional permissions should be obtained from the applicable author or publisher of the image. Full text @ J. Virol.