
Image
|
Figure Caption
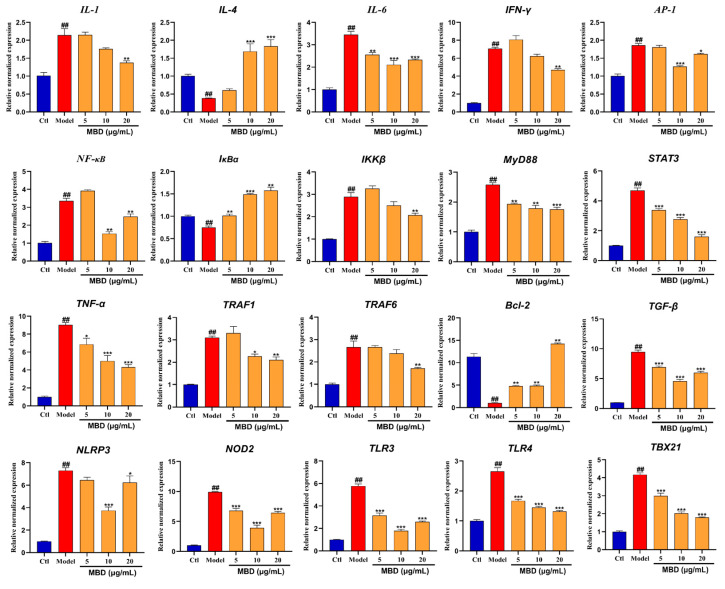
Figure 8
mRNA expression of genes involved in inflammation after MBD exposure. Gene mRNA expression is shown as the relative expression by fold compared to the Ctl. ##
Acknowledgments
This image is the copyrighted work of the attributed author or publisher, and
ZFIN has permission only to display this image to its users.
Additional permissions should be obtained from the applicable author or publisher of the image.
Full text @ Mar. Drugs