
|
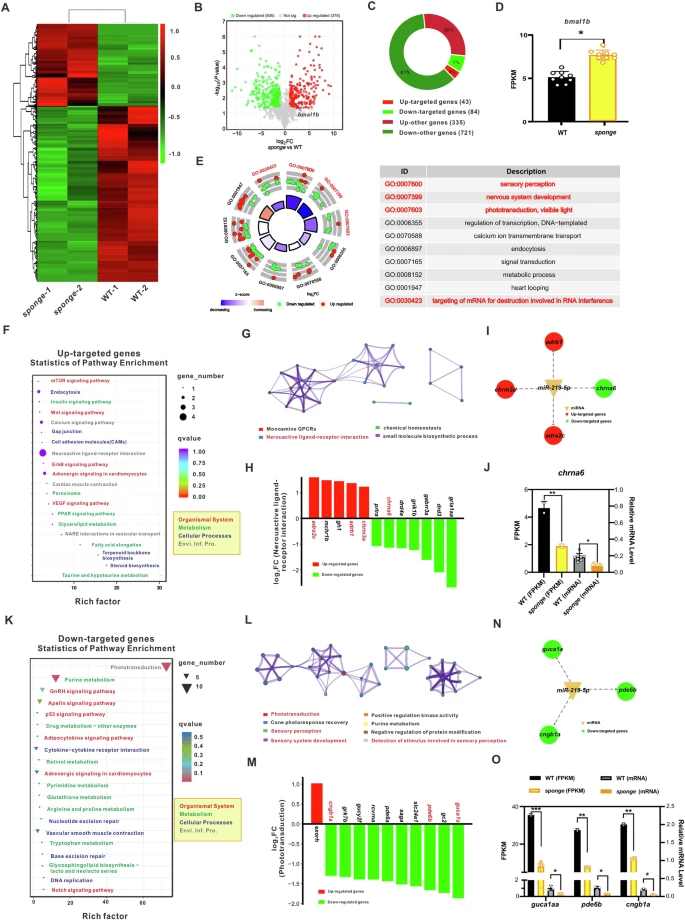
Fig. 7 Transcriptome analysis of the adult brains of Tg(hsp70l:miR-219 sponge;CG2) zebrafish.The heatmap (A) and volcano plot (B) show 805 down-regulated genes (green) and 378 up-regulated genes (red) in adult brains of Tg(hsp70l:miR-219 sponge;CG2) zebrafish (sponge). Among them, bmal1b, a target gene of miR-219-5p, is an upregulated gene. C Donut chart displays the classification of differentially expressed genes (DEGs) as miR-219-5p targeted genes that contain the target sequence in their 5’UTR and miR-219-5p non-targeted genes without the target sequence in their 5’UTR, including 43 (4%) up-regulated targeted genes (red), 84 (7%) down-regulated targeted genes (green), 335 (28%) other up-regulated genes (crimson), and 721 (61%) other down-regulated genes (dark green). D Expression of bmal1b in the brains of Tg(hsp70l:miR-219 sponge;CG2) (yellow) and WT (black), determined by FPKM. E GO circle of miR-219-5p up-regulated and down-regulated targeted genes in terms of Biological Process (BP). F, G KEGG enrichment analysis and Metascape illustration (G) of miR-219-5p up-regulated target genes. H Bar plots of up-regulated genes (red) and down-regulated genes (green) involved in the neuroactive ligand-receptor interaction pathway. miR-219-5p targeted genes are in red. I The miRNA-mRNA target network for the neuroactive ligand-receptor interaction pathway. Shown are miR-219-5p (orange triangle), Up-targeted genes (red circle), and Down-targeted genes (green circles). J Expression of chrna6 in the brains of Tg(hsp70l:miR-219 sponge;CG2) (FPKM) (yellow), WT (FPKM) (black), Tg(hsp70l:miR-219 sponge;CG2) (mRNA) (orange) and WT (mRNA) (gray), determined by FPKM and qRT-PCR. Data are mean ± SD. n = 3 × 3. Unpaired two-tailed Student’s t-test was performed, *P < 0.05, **P < 0.01 vs. WT. K, L KEGG enrichment analysis and Metascape illustration (L) of miR-219-5p down-regulated targeted genes. M Bar plots of up-regulated genes (red) and down-regulated genes (green) involved in phototransduction. miR-219-5p targeted genes are in red. N The miRNA-mRNA target network for phototransduction. Shown are miR-219-5p (orange triangle) and Down-targeted genes (green circle). O Expression of guca1aa, pde6b, and cngb1a in the brains of Tg(hsp70l:miR-219 sponge;CG2) (FPKM) (yellow), WT (FPKM) (black), Tg(hsp70l:miR-219 sponge;CG2) (mRNA) (orange) and WT (mRNA) (gray), determined by FPKM and qRT-PCR. Data are mean ± SD. n = 3 × 3. Unpaired two-tailed Student’s t-test was performed, *P < 0.05, **P < 0.01, *** P < 0.001 vs. WT. See also Fig. S11.