
|
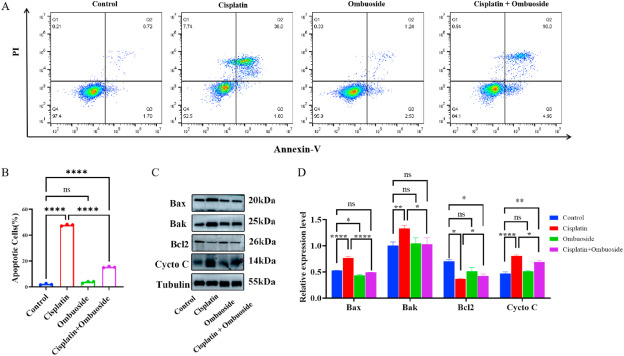
Fig. 2 Ombuoside protects HEI-OC1 cells against cisplatin-induced apoptosis. A. Cell apoptosis analysis by flow cytometry. Negative autofluorescence control (using untreated cells without dyes) and positive controls (using fixed untreated cells stained with AX or PI) were employed to set the parameters of the cytometer. Comparison between cells treated with cisplatin alone and co-treated with ombuoside, N = 3. The upper right quadrant (Q2) represents apoptotic cells. B. Quantification of apoptotic cells in Fig. 2A, N = 3. Data are presented as mean ± SEM. ∗∗∗∗P ≤ 0.0001. C. Western blot showing the expression of apoptosis-associated proteins in HEI-OC1 cells treated with cisplatin alone and co-treated with ombuoside using tubulin as a reference. (The non-adjusted blot image is included in supplementary material) D. Quantification of protein expression in Fig. 2C. Data are presented as mean ± SEM. ∗P ≤ 0.05, ∗∗P ≤ 0.01, ∗∗∗P ≤ 0.001, and ∗∗∗∗P ≤ 0.0001.