
|
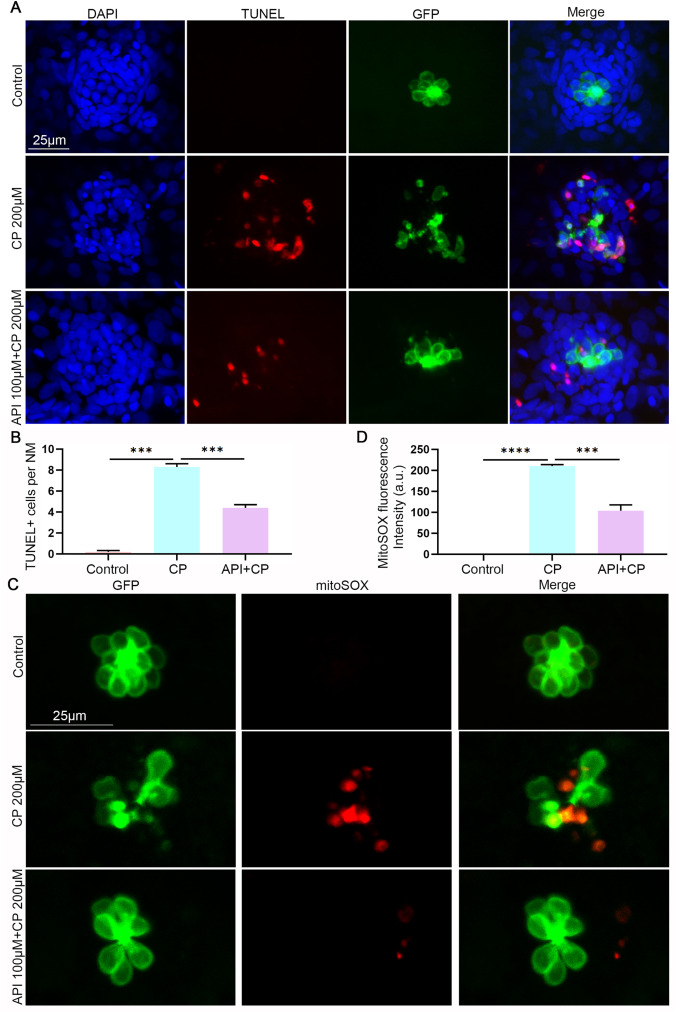
Fig. 2 Apigenin protects against cisplatin-induced ROS accumulation and cell death in neuromasts. (A) TUNEL assay (red) and corresponding DAPI staining (blue) were performed in zebrafish in the presence/absence of apigenin (100 μM) and cisplatin (200 μM). (B) Quantification of TUNEL-positive cells per neuromast for each treatment, presented as mean ± SEM. (C) ROS generation detected by MitoSOX staining, followed by fluorescence microscopy imaging. (D) Quantification of MitoSOX fluorescent intensity for each treatment, presented as mean ± SEM. Statistical significance indicated as ∗∗∗P < 0.001, ∗∗∗∗P < 0.0001. The scale bar equals 25 μm. (For interpretation of the references to colour in this figure legend, the reader is referred to the Web version of this article.)